
The Option Life Cycle
By: Todd Horwitz
The following is an excerpt from Todd "Bubba" Horwitz's Bubbas Guide to Trading Options
Options are priced differently than any other class of assets. The auction market is still the mechanism used to discover price, however volatility (implied volatility) will determine the normal price at any point in time.
Visualize the option model to be a balloon attached to the spot, or market price of an asset, in this case a stock. As you pump air into the balloon it expands equally in all directions. The more air added, the bigger the balloon’s expansion. Think of the air going into the balloon as option “premium”. This is the amount that buyers are willing to pay over the “intrinsic value” to own an option at a particular strike price.
If we were to suck all of the air out of the balloon, the option price would fall back to a specific “flat” cost relative to the underlying asset (current market price of our stock). The option model expands in all directions. The longer time to expiration OR the higher the volatility (more “air”) for an option with an At-The-Money (ATM) strike price – which has no intrinsic value – the option’s absolute value (price) at all strike prices would be higher.
Option pricing is based on the strike price, time to expiration and volatility of the underlying asset.
Let’s look at some examples. For simplicity’s sake we are going to use only one underlying asset. The options you will be trading will have different underlying asset classes and strike prices, but the principal will remain the same.
We will use Google as our illustration. Google is one of the largest option contracts in the world and can be followed by anyone interested in the markets. Our trading example will use the nominal price of 500, making the 500 strike the ATM strike price.
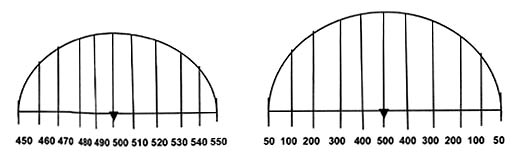
Below are graphic representations of our discussion. Think of a bell shaped curve. The first curve shows strike prices along the x-axis in a static, linear progression in $10 increments. The second shows curve for the same option, but here we are illustrating the geometric, descending value of the option prices the further you get away from the strike price. See the graphic difference? Option prices are not linear!
Now let’s look at a tabular representation of our example. Here, we’ve added volatility increases: 10, 20 and 30%. This is a very simple example, but the concept is clear. As the volatility expands for the ATM, it flows over to strike prices. This makes logical sense as the at-the- money option contract has no intrinsic value, it’s all premium.
Strike Price
ATM
VOL |
450 |
460 |
470 |
480 |
490 |
500 |
510 |
520 |
530 |
540 |
550 |
10% |
50 |
100 |
200 |
300 |
400 |
500 |
400 |
300 |
200 |
100 |
50 |
20% |
100 |
200 |
400 |
600 |
800 |
1000 |
800 |
600 |
400 |
200 |
100 |
30% |
200 |
400 |
800 |
1200 |
1600 |
2000 |
1600 |
1200 |
800 |
400 |
200 |
The letter below the strike represents whether it is a put or call.
The option model functions much like a “bell shaped curve”. The further the option is from the ATM, the less the probability the option will ever be in-the-money at expiration. Sellers are willing to write the option for less premium. The bell shaped curve functions until buyers are no longer willing to pay any premium for a given strike price. Traditionally, when the buyer will pay only the minimum “tick size”, the option is referred to as a “teenie” or a “stinth” (1/16).
Although theoretically there are no limits as to how high volatility can go, there are some practical ones. If volatility were to continue to expand exponentially, buyers of premium would have very little, if any, chance of ever cashing a trade. The sellers on the other hand would have very little risk of price expanding far enough from the ATM strike to cause the premium that they sold to ever become a loss.
Consequently, for our purposes, when time and price converge at this extreme, volatility is said to be “absolute”. In order for volatility to expand, price does not have to change. It is the anticipation of a price change that drives option volatility. The level of volatility correlates with the supply and demand for an option.
All options have zero volatility at expiration. Options will either have intrinsic value or they will be worthless, in either case the premium, the extrinsic value of an option at expiration will terminate.
As we know, time and price are linked in any market. Depending on your school of thought, time is either the first or second most important factor in pricing an option. The passing of time is a known dimension. Each day as time passes, the probability of price moving away from the ATM is slightly condensed. Since the probability of a large price change diminishes with time, the buyer is not willing to pay as much for an option. This is the definition of “time decay”. Time decay is not a function of volatility; time decay is a quantifiable number that increases each day with the passage of time.
Let’s revisit our simplified option model. In this chart we are using the Google 500 strike as we did beforehand. A new column has been added (Days) to include days to expiration. In addition, volatility has been standardized at 40%.
You will notice that as time passes, the amount of premium at any level decreases significantly, even as volatility remains constant. If the volatility were to decrease, the premium would come out of the model at a faster rate. As the time to expiration nears, even if the volatility were to double; the price of the option would no longer double. It would initially inflate the balloon, but eventually time would squeeze the premium out; the balloon deflates.
Strike Price
ATM
VOL |
|
P |
P |
P |
P |
P |
P/C |
C |
C |
C |
C |
C |
40% |
30 |
100 |
190 |
360 |
540 |
800 |
1000 |
800 |
540 |
360 |
190 |
100 |
40% |
60 |
160 |
320 |
640 |
960 |
1280 |
1600 |
1280 |
960 |
640 |
320 |
160 |
40% |
90 |
200 |
400 |
800 |
1200 |
1600 |
2000 |
1600 |
1200 |
800 |
400 |
200 |
What we have detailed here is essentially the life cycle of an option. The inflation of the balloon is time and/or volatility. The longer the time frame to expiration, the bigger the balloon. The balloon deflating represents time decay. When the balloon is deflated entirely, we have expiration.
EVERY OPTION THAT YOU TRADE WILL HAVE THE EXACT SAME CYCLE NO MATTER WHAT THE UNDERLYING ASSET!
I know what you’re thinking; “All of the books about options are hundreds of pages long. They are full of math formulas, statistical probability, the Greeks… how could even a Rocket Scientist understand it? And you want me to believe that options are this easy? From a couple of charts about balloons and circles you’re saying I can make money in the markets?”
The answer is absolutely, positively… YES! If you can visualize the option cycle in terms of air going in and out of a balloon, you have won half the battle!