
Using Option Volatilities to Time Market Movements
By: Kathy Lien
The following is an excerpt from Kathy Lien's Day Trading the Currency Market
Using option volatilities to time foreign exchange spot movements is a very useful strategy that is a favorite among professional hedge funds. Implied volatility can be defined as a measure of a currency’s expected fluctuation over a given time period based on past price fluctuations. This is typically calculated by taking the historic annual standard deviation of daily price changes. Future prices help to determine implied volatility, which is used to calculate option premiums. Although this sounds fairly complicated, its application is not. Basically, option volatilities measure the rate and magnitude of a currency’s price over a given period of time based on historical fluctuations. Therefore, if the average daily trading range of the EUR/USD contracted from 100 pips to 10 pips and stayed there for two weeks, in all likelihood short-term volatility also contracted significantly compared to longer-term volatility during the same time period.
As a guideline, there are two simple rules to follow. The first one is that if short-term option volatilities are significantly lower than long-term volatilities, one should expect a breakout, though the direction of the breakout is not defined by this rule. Second, if short-term option volatilities are significantly higher than long-term volatilities, one should expect a reversion to the trading range.
Why Do These Rules Work?
During a ranging period, implied option volatilities are either low or on the decline. The inspiration for these rules is that in periods of range trading, there tends to be little movement. We care most about when option volatilities drop sharply, which could be a sign that a profitable breakout is under way. When short-term volatility is above long-term volatility it means that near-term price action is more volatile than the long-term average price action. This suggests that the ranges will eventually contract back toward average levels. The trend is most noticeable in empirical data. Here are a few examples of when this rule accurately predicted trends or breaks.
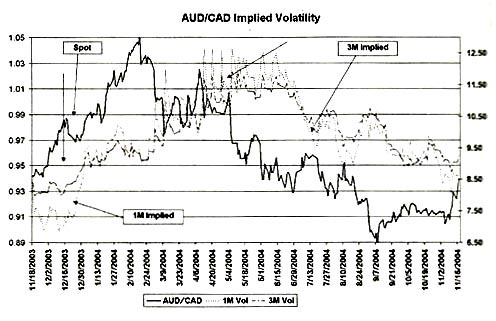
Before analyzing the charts, it is important to note that we use one-month volatilities as our short-term volatilities and three-month volatilities as our longer-term volatilities.
In the AUD/CAD volatility chart below, for the most part, shorter-term volatility is fairly close to the longer-term volatility. However, the first arrow shows an instance where short-term volatility spiked well below long-term volatility, which, as indicated by our rule, suggests an upcoming breakout scenario in the currency pair. AUD/CAD did eventually break upward significantly into a strong uptrend.
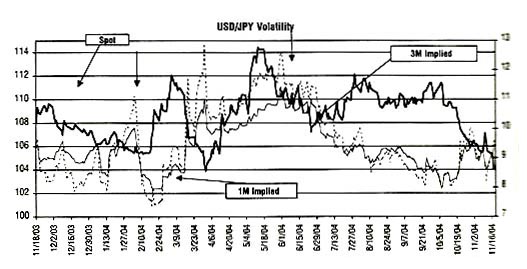
The same trend is visible in the USD/JPY volatility chart shown below. The leftmost arrow shows an instance where one-month implied volatility spiked significantly higher than three-month volatility; as expected, the spot price continued to range. The next downward arrow points to an area where short-term volatility fell below long-term volatility, leading to a breakout that sent spot prices up.
Who Can Benefit from These Rules?
This strategy is not only useful for breakout traders, but range traders can also utilize this information to predict a potential breakout scenario. If volatility contracts fall significantly or become very low, the likelihood of continued range trading decreases. After eyeing a historical range, traders should look at volatilities to estimate the likelihood that the spot will remain within this range. Should the trader decide to go long or short this range, he or she should continue to monitor volatility as long as they have an open position in the past to assist them in determining when to close out of that position. If short-term volatilities fall well below long-term volatilities, the trader should consider closing the position if the suspected breakout is not in the trader’s favor. The potential break is likely to work in the favor of the trader if the current spot is close to the limit and far from the stop. In this hypothetical situation, it may be profitable to move limit prices away from current spot prices to increase profits from the potential break. If the post price is close to the stop price and far from the limit price, the break is likely to work against the trader, and the trader should close the position immediately.
Breakout traders can monitor volatilities to verify a breakout. If a trader suspects a breakout, he or she can verify this breakout through implied volatilities. Should implied volatility be constant or rising, there is a higher probability that the currency will continue to trade in range than if volatility is low or falling. In other words, breakout traders should look for short-term volatilities to be significantly lower than long-term volatilities before making a breakout trade.
Aside from being a key component for pricing, option volatilities can also be a useful tool for forecasting market activities. Option volatilities measure the rate and magnitude of the changes in a currency’s prices. Implied option volatilities, on the other hand, measure the expected fluctuation of a currency’s price over a given period of time based on historical fluctuations.
Tracking Volatilities
Volatility tracking typically involves taking the historic annual standard deviation of daily price changes. Generally speaking, we use three-month volatilities for long-term volatilities numbers and one-month volatilities for the short term. The next step is to start compiling a list of data for date, currency pair price, implied one-month volatility, and implied three-month volatility for the currency pairs that you care about. It might also be beneficial to find the difference between the one-month and three-month volatilities to look for large differentials or to calculate one-month volatility as a percentage of three-month volatility. Once a sufficient amount of data is compiled, one can graph the data as a visual aid.