Reversal Chart Formations
By: Ray Frazier
The following is an excerpt from Ray Frazier's Huge Profits Now!!
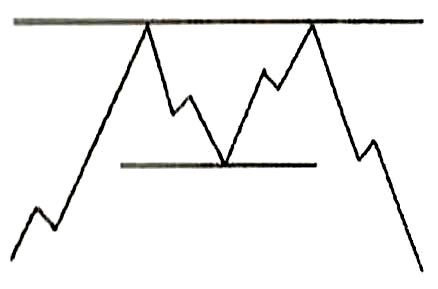
Double Top
The double top formation is considered a reversal pattern. The first top in the formation is formed by a rally in the stock on higher than average volume, only to see sellers come in to drive the stock price lower. The second top is formed by another rally in the stock but on lower volume than the previous top. The correction in the stock from the first top should be approximately 15%. The second top should be below the first tip (within 3%). The completion of this formation is as the stock price tips past the prior correction. The second correction will usually last for several weeks.

Double Bottom
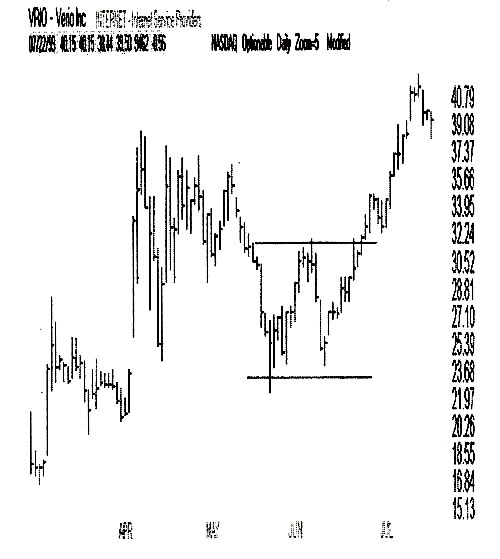
The double bottom is considered to be a reversal pattern. The first bottom is formed on high-volume as investors bail out of the stock for one reason or another. This is followed by a rally of at least 15% as investors figure that the stock has hit bottom. This rally is met with selling from investors that did not get out during the first sell off. The second bottom is formed on lower volume than the first bottom and should be within 3% of the first. Confirmation of the reversal is when the second rally takes the stock above the peak of the first rally.
Below is an example of a double bottom formation. As you look at the chart, you can see that after the stock crosses the resistance line it continues to climb for about three weeks.

Head and Shoulders
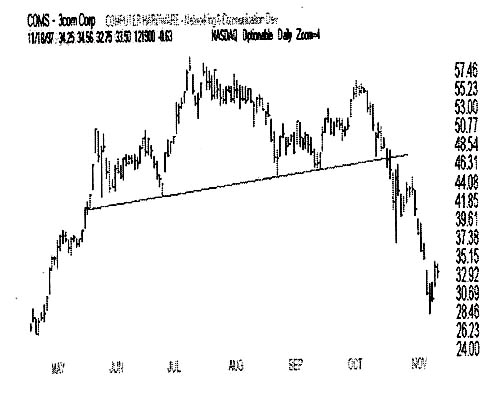
This formation is also considered to be a reversal pattern. The head and shoulders formation has four features that must be met before you should consider positioning yourself for the reversal. First, the left shoulder should be formed on high volume followed by a top. The top is met with a sell off on low volume as investors take some profits off the table. The head is formed by another high-volume rally reaching a higher level than the left shoulder before forming a top. The top is met by yet another bout of profit taking on lower volume than the rally. This bout of profit taking should take the stock price to a level near, if not even with, the bottom of the previous sell off. The right shoulder is formed with a low volume rally. This rally should take the price of the stock higher, but the stop should fall short of the top-level of the head. The neck line is a straight line that connects the bottoms of the left shoulder, the head and the right shoulder as it falls through the previous bottom that formed the head. The stock price should fall at least 2-3% below the neck line before considering the formation to be a true head and shoulders pattern.
Note that the neck line does not have to be only horizontal. The neck line can be angled upward, downward, and horizontal. An example of an upward angled neck line has been provided in the chart below.

Inverted Head and Shoulders
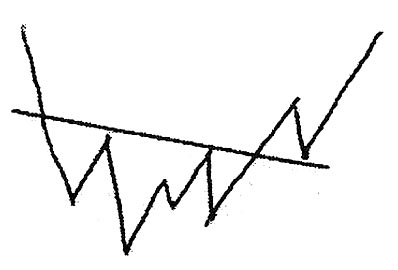
The last formation we will talk about here is also considered a reversal pattern, similar to the head and shoulders pattern, except for it being inverted. Normally seen in downtrends, the formation is formed like so… the left shoulder forms as the stock corrects. Investors come in to buy the dip, and the stock rallies on high volume until it meets resistance. Sellers come in at this point and take the stock lower than the bottom of the left shoulder, but on light volume. Buyers see the “bargain” price of the stock and take the stock higher on heavier volume than the left shoulder rally, only to be met with selling at the resistance line. This forms the head. Sellers come back in to take the stock down on the lightest volume of all. Then the stock rallies on a huge increase in volume to form the right shoulder. The stock price crosses the resistance line and is met by sellers once again. The stock price bounces off the previous resistance line and rallies on strong volume.
