
The Perspective of Multiple Time Frames
By: Oliver Velez
The following is an excerpt from Oliver Velez's Swing Trading Home Study Course
The concept of handling multiple time frames is a very important topic for traders to learn. It is necessary for all traders to understand this idea, as it affects trading at all levels.
All of the charts presented here are to analyze the market one morning as seen through the NASDAQ 100 Trust (QQQQ). We are looking at the implications of a morning breakdown and the expected follow through for the morning and the rest of the day.
From what we can see in the first chart, the 10:00 decline broke todays low of the day and some support from the end of yesterday. Is this as short as a scalp? Based on what we can see, some support has been broken. It is not enough to see some support broken. We need to see more of this chart or the chart of the next higher time frame (5-minute, 15-minute) to analyze the trend and other support levels.
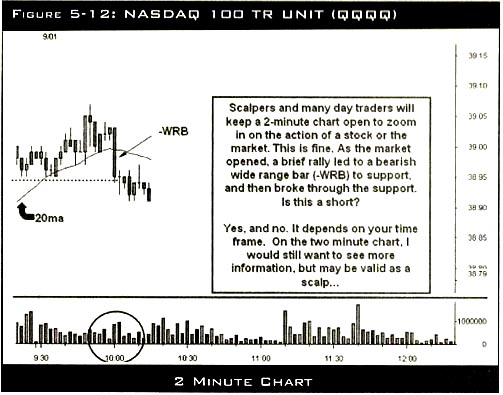
While in a sense, there may be enough here to justify a micro-scalp, how does the trader know if this is a micro-scalp, half-day trade, day trade, or even more? A key to remember is that a scalp is a time frame, not a strategy. (Scalping is a trading style specializing in taking profits on small price changes, generally soon after a trade has been entered and has become profitable.) I will often hear traders try to justify an ill-conceived play by hiding behind the rationalization that it is a scalp. A bad trade taken for a shorter period of time is still a bad trade.
The key here is not to assume more from this breakdown than what this 2-minute chart has to offer. The problem is that many day traders focus so intensely on a 2-minute chart, they lose sight of the bigger picture.
Lets look at how the other time frames come together on this one. First, I want to jump way to the other extreme, the weekly chart, shown below. Is the weekly necessary for analyzing a true scalp? No. Why show it here? I always start from the top down and it may have some influence on your daily bias.
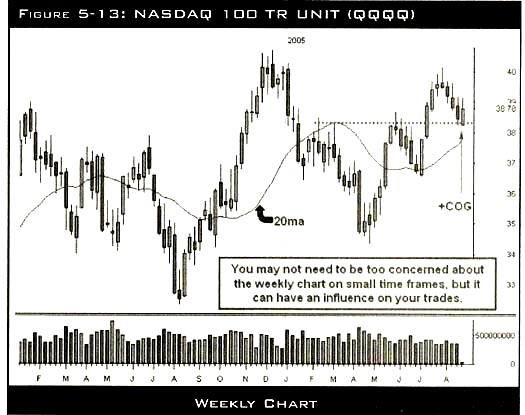
Here we see the big picture. We appear to be in the beginning of a buy set up on the weekly chart. The bullish bias will carry down to the daily chart and may influence your daily bias. While it is not relevant to analyze the scalp part of the 2-minute chart, it can be relevant in our bias for the rest of the day. For what it is worth, we pick up a bullish daily bias from the weekly.
Now, lets get to the chart with some real influence for a day trader; the hourly (60-minute) chart. Here we pick up some key information. When day trading, you do not want to be against the hourly trend for long. Until 8/30/05, the hourly had been in a downtrend for quite a while. We see for the most part, lower pivot highs, lower pivot lows, trend lines pointing down, and price staying under the declining 20 period moving average (d20ma) most of the time. On 8/30/05 that higher low led to a series of higher highs (HH) and higher lows (HL), and a rally above the d20ma.
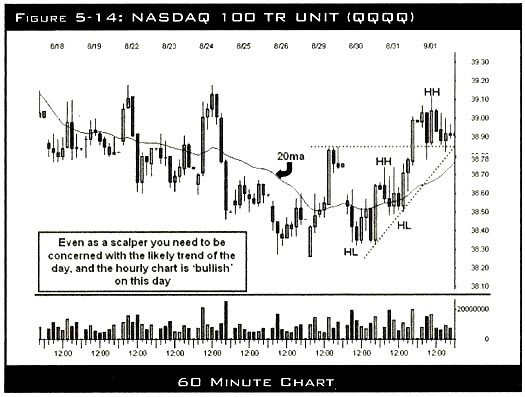
The consolidation that formed on 9/1/15, which is the day in question, was bullish. This gave us a bias of wanting to be on the long side for the day, but the hourly chart is doing little to help us see a possible entry to that long side. So, we enter the 15-minute chart. Here, things begin to come clear. We enter this chart knowing that the bigger time frames will keep us with a bullish bias. Now we have actionable areas. We can see that the original 2-minute breakdown that began has enough room to fall to be an acceptable scalp, due to the extended move on the hourly and 15-minute charts. We can also see a clear target area, the minor support offered by the triple topping tail highs on 8/31/05.
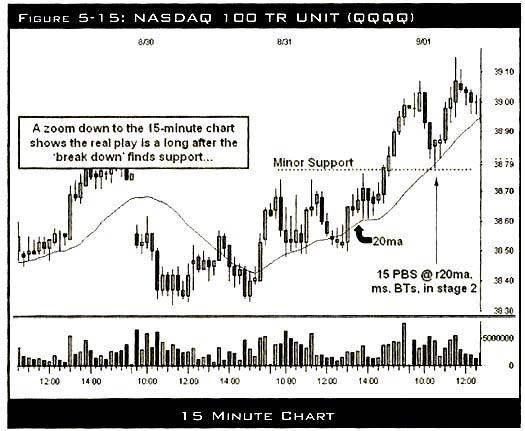
As we hit this area, a very clean 15-minute buy set up forms right at a 10:30 reversal time. The buy set up is at minor support, with bottoming trails, right around a 50% retracement and right at the r20ma. This rally takes us to a new daily high and our job is done.
In summary, the original 2-minute breakdown was acceptable as a short scalp only because we had enough of a support area broken and there was an extended move up that left a clear void of demand and the next support area was far enough away to justify the play. The real play for the day trader was patience in waiting for reversal time, and a clean set-up in a clear demand area.