
The Doji: Two-Day Reversal Patterns
By: Adam Oliensis
The following is an excerpt from Adam Oliensis' Stock Chart Analysis & Dynamic Trading System
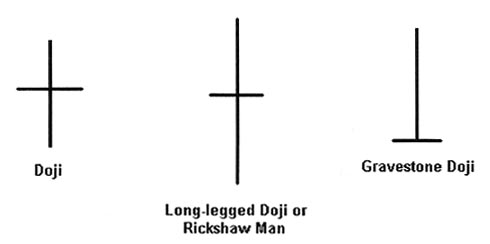
One of the most important reversal candlesticks is the Doji. A doji is characterized by opening and closing prices that are identical (or virtually identical). The ideal doji, with the same opening and closing price, has a real body that is a horizontal line. However, in the real world a difference of a few ticks doesnt diminish the dojis importance. Precisely how large the real body can be before the candlestick is no longer a doji is a somewhat subjective matter. In context, though, a doji is what looks like a doji. And the more it looks like a doji the more powerful a reversal signal it is likely to be.
Below are three variations on the doji candle. The long-legged doji is especially powerful, because the battle between the bulls and the bears has been all over the map during that period. Theyve taken it high; theyve taken it low. Each side has pressed the offensive and then retreated with its tail (bovine or ursine) between its legs. And in the end both sides are frustrated.
This frustration is perhaps at the heart of the meaning of the doji, and part of why a high volume doji is especially powerful. In such a session, each side throws a lot of money at the issue and neither side comes away a winner. Now, who has more to protect? After a sustained uptrend the bulls have more to protect. After a downtrend it’s the bears. The doji represents a stalemate. This is an abatement of momentum. If the momentum of an uptrend stalls out, bulls are likely to take some profits (and vice-versa in a downtrend). The doji may represent the exhaustion of the conviction that has previously predominated, and a rousing of the opposing conviction. That may be why the doji is such a powerful reversal candle.
Dojis are all the more powerful when placed in particular overbought and oversold positions, which is to say within the two-day and three-day patterns. We are going to look at some two-day patterns here. There are a number of two-day candlestick patterns that suggest reversals. The most basic ones are: engulfing patterns, dark-cloud covers, piercing pattern, and the harami.
Engulfing Patterns
A bearish engulfing pattern shows itself in an uptrend. The first candle should be white and the second candle dark. There are exceptions to this idea, but only if the first candle has a very small real body. In that case, a bearish engulfing pattern could have a dark first candle. The real body of the second candle should “engulf” the real body of the first candle; its opening price is higher than the prior session’s close and its close is lower than the prior session’s open. This pattern is considered a major reversal formation and indicates that after a higher open the bears have taken control of the session and dominated.
A bullish engulfing pattern shows itself in a downtrend. The first candle should be dark and the second candle white. Exception: only if the first candle has a very short real body can it be white. The second candle engulfs the real body of the first candle; its opening is lower than the first candle’s close and is higher than the first candle’s open. After a lower open, the bulls have seized control and dominated right into the close.
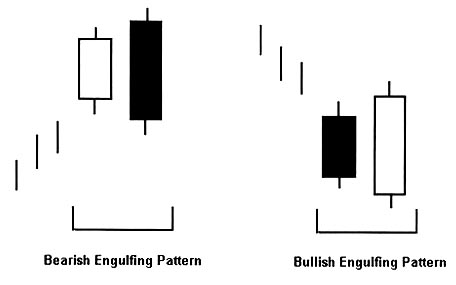
An engulfing pattern is a strong sign that the balance of power between the bulls and bears has reversed, and that the “umph” in the prior trend may be waning. Engulfing patterns become even more powerful if the second candle in the pattern comes on greatly increased volume, which indicates a more powerful interest in the reversal. They are also especially powerful when the second candle engulfs multiple prior sessions.
Dark-Cloud Cover and Piercing Pattern
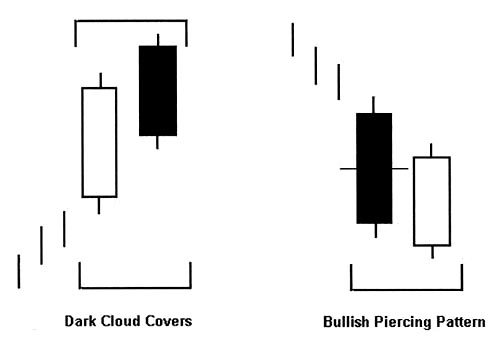
The Dark-Cloud Cover is a bearish pattern that derives from the same day dynamic as the bearish engulfing pattern. Dark-cloud cover shows itself in an uptrend, or at the top of a trading range. The first candle is a strong white one. The second candle in the pattern then opens higher than the first candle’s high and sells off, so that the close is deep into the real body of the first candle. The deeper into the first candle’s real body it closes, the more bearish it is. An ideal dark-cloud cover closes more than halfway down into the first candle’s real body.
Let’s think about what it would be like to trade this situation. Suppose you want to short a stock that has been in an uptrend, and suppose that you see this formation. (Note: Normally you’d rather short a failing trend than a strong one. Countertrend trades are tougher than trading with the trend). It looks like the bulls are unable to sustain control in the second candle of the pattern, and you’re thinking they’re going to give up some more ground. You could intelligently enter your short with a natural exit price at or near the high of the second candle. This formation provides an excellent natural exit parameter with an appealing risk/reward ratio; the stock hasn’t moved too terribly far down off its high. It becomes even more appealing as a sell signal if it’s at a resistance level.
The Bullish Piercing Pattern gives you the same dynamic as the dark-cloud cover, but in reverse. The piercing pattern’s second candle opens below the low of the first candle, then moves up and closes above the midpoint of the first candle’s real body. While it doesn’t get as far as to “engulf” the first candle, the bears have lost control of the second session and begun to cover. The bulls are gaining confidence. The natural “stop loss” on this bullish signal is at or near the low of the second candle in the pattern.
Though engulfing patterns are perhaps stronger reversal signals, I have noticed that often times the very strength of the engulfing pattern makes it a little trickier to play. Often the stock has moved so far so quickly on the engulfing pattern that it may languish for several sessions as it consolidates the very quick gains. The bullish piercing pattern and the dark-cloud cover have tighter natural exit points and may have more of their short-term gains on the reversal ahead of them rather than behind. Sometimes it’s appealing to wait a bit after an engulfing pattern, before going long, so that the stock can give up one-third to one-half of the second candle’s gain.
Necks and Thrusting Patterns
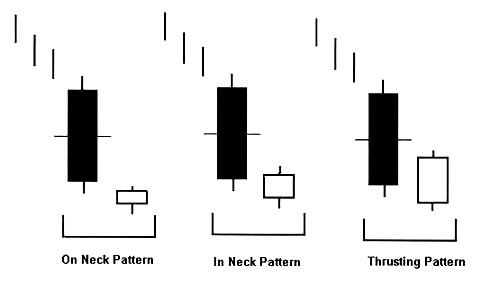
The On Neck, In Neck, and Thrusting patterns resemble the piercing pattern, but don’t be fooled. They are somewhat bearish rather than bullish. They are not reversal candles, but I’ve included them here because they contrast so specifically to the piercing pattern and illustrate an important idea that pertains to “Fibonacci Retracements”. The second candle of each of these patterns opens below the low of the first candle. The second candle of the On Neck is a short, white candle that closes near the low of its predecessor. The second candle of the In Neck pattern is also white, and closes slightly up into the real body of the first candle of the pattern. The Thrusting pattern has a long white second candle, but that candle’s close is below the midpoint of the first candle. In all these cases we can see a market that is unable to regain even half of the prior session’s loss. A move below the low of any of these three patterns is an indication that further weakness lies ahead.
Note: A thrusting pattern may be bullish in either a rising market, or if two or more of them show up within just a few sessions.
The most important thing to keep in mind here is that the midpoint of the first candle has proven to be resistance to further upside movement. That’s what makes them potentially bearish.
Harami Pattern
“Harami” is an archaic Japanese word meaning “pregnant”. The harami pattern is formed when a longish candle that moves in the direction of an existing trend is followed by a candle with a small real body that is contained between the Open and Close of the longish real body. The long real body is the mother. It contains the small real body, the baby.
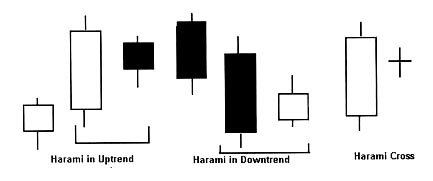
In an uptrend a harami pattern tends to be bearish, while in a downtrend it tends to be bullish. It may not be as powerful a reversal pattern as a “hammer” or, say, an engulfing pattern, and may signify that momentum will abate rather than strongly reverse. The color of the “baby” may be either the same or the opposite of that of the “mother”. More often than not, though, it will be the opposite.
Perhaps the most powerful sort of harami is the Harami Cross, in which the baby is a doji candle. The harami cross is considered to be a major reversal pattern because of the power of the doji candle.