
TD Price Projections
By: Thomas DeMark
The following is an excerpt from Tom DeMark's The New Science of Technical Analysis
There are three distinct methods to calculate price projections once a trendline is penetrated validly; I call them TD Price Projectors. The particular technique selected is a function of the degree of precision and accuracy required by the user.
Early on, I concluded that important supply price pivot points were identified once a high was recorded that was not exceeded on the upside the day immediately before as well as the day immediately after. Conversely, to define demand price pivot points, just the opposite approach was employed: a low was recorded that was not exceeded on the downside the day immediately before as well as the day immediately after. This made sense to me; these were critical days that proved to be trend turning points in price activity. Supply overcame demand and price declined, and demand overcame supply and price advanced. I have labeled these key price points as TD Points.
Once the TD Points are identified, they are connected to construct TD Supply Lines and TD Demand Lines (TD Lines). The real attraction of this method of point selection was that it was dynamic. In other words, the market itself announced any changes in the supply-demand equilibrium equation by continuously resetting TD Points. Consequently, TD Lines are constantly being revised as more recent TD Points are being formed. The importance of the selection of the most recent TD Point and its connection to the second most recent TD Point as well as the construction of the TD Line itself becomes apparent.
TD Points and TD Lines are used to identify support and resistance levels, as well as in facilitating the process of calculating price projects.
TD Price Projector 1, the least precise and the easiest to calculate, is as follows: when price advances above a declining TD Line, usually price continues to advance to at least a price level equivalent to the distance between the lowest price value beneath the TD Line and the TD Line value directly above it, added to the TD Line value on the day of the breakout to the upside. What may sound complex when described in words is very simple when viewed on a chart like the one below.
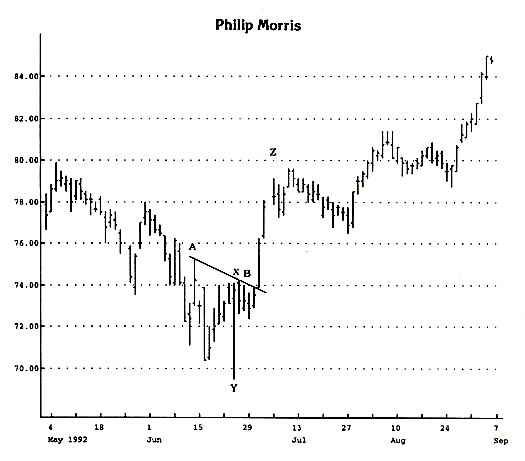
See how price gapped above A-B TD Supply Line and how by adding the difference between X – the value of the TD Line immediately above Y – and Y – the lowest price beneath the A-B Line, the price projection Z is determined.
Conversely, the identical symmetry is apparent when price declines below and ascending TD Line. Usually, price continues to decline to at least a price level equivalent to the distance from the highest price value above the TD Line to the TD Line value directly beneath it, subtracted from the TD value on the day of the breakout to the downside.
Often, visual inspection will allow the user to forecast approximate price objectives; most traders require more precision, however. Basic arithmetic will enable the user to calculate the rate of change of a TD Line simply by dividing the difference between the two TD Points by the number of days between them (excluding non-trading days). Further, by multiplying the additional number of trading days from the most recent TD Point to that precise point at which the TD Line is penetrated by the rate of change, the exact breakout value can be calculated.
Rate of Change Calculation of TD Line
- Count the number of days from the most recent TD Point to the second most recent TD Point.
- Calculate the price difference between the two TD Points.
- Divide the difference between the two TD Points by the number of trading days separating the two TD Points to arrive at the daily rate of advance (rate of decline).
- Multiply the rate of advance (decline) by the number of trading days to the breakout price in order to calculate the exact breakout price for the purposes of arriving at a precise price objective.
- Identify both the highest high above an ascending TD Line (the lowest low below a descending TD Line) and the value of the TD Line immediately below the highest high (above the lowest low). Next, calculate the difference between the highest high (lowest low) and the TD Line, and subtract the value from (add to) the breakout price.
To that breakout value, the difference between the TD Line and the trough/peak immediately below/above – depending on whether it is a buy or a sell – can be added or subtracted to arrive at a price objective. Once again, what may appear complicated becomes much clearer when displayed on the charts.
TD Price Projector 2 is somewhat more complex. For example, in the case in which price exceeds a declining TD Line, instead of selecting the lowest price beneath the TD Line and adding that value to the breakout point, there is a slight variation. The intraday low price on the day of the lowest closing price beneath the TD Line is selected. Often, the lowest intraday low is recorded on the same day as the lowest close, so there exists no difference between TD Price Projectors 1 and 2: but, in those instances when the lowest close day and the lowest low day are not coincident, the adjustment is made.
The chart below will illustrate the distinctions between the two methods. As you can readily see, using the intraday low as the reference point, regardless of the close that day relative to all other closes beneath the TD Line, as TD Price Projector 1 requires, is considerable more liberal and simpler to calculate. On the other hand, TD Price Projector 2, using the intraday low of the lowest close day, is a little more difficult in arriving at a price objective once a declining TD Line is exceeded upside. Conversely, to arrive at downside price projections when an ascending TD Line is broken, the reverse procedure is employed. In this case, the key day to concentrate on is the highest close day or, more precisely, the intraday high that particular day. Although it may appear that TD Price Projector 2 is more precise and conservative than Projector 1, this is not always the case.
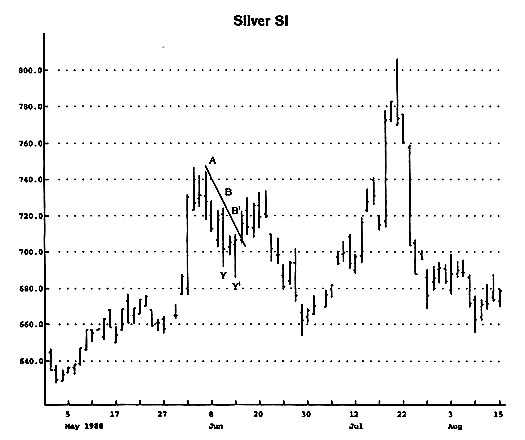
TD Price Projector 2 is not the same as TD Price Projector 1 in this example because the lowest close (Y) below TD Supply Line A-B is not on the same day as the lowest low (Y’). Even though the breakout point is the same value, the difference between Y and the value immediately above it on Supply Line A-B is different from the difference between Y’ and the value immediately above it on Supply Line A-B. Consequently, the price objectives are not the same.
For example, if the rate of advance or decline is particularly steep and the lowest close in the case of a downtrend or the highest close in the case of an uptrend – the reference day for Projector 2 – occurs before the intraday low or intraday high, then the price objective for Projector 2 is greater. Conversely, if the low or the high close day beneath or above the trendline occurs subsequent to recording the intraday low or high, then Projector 2 is less. Personally, I prefer Projector1 to Projector 2, but I believe that Projector 2 is valid and is a viable option.
TD Price Projector 3 is more conservative generally than the prior two methods. To calculate the price projection value in the instance of a declining TD Line, merely calculate the difference between the TD Line and the CLOSE of the lowest intraday low day immediately beneath it, NOT the intraday low itself. The chart below provides an example.
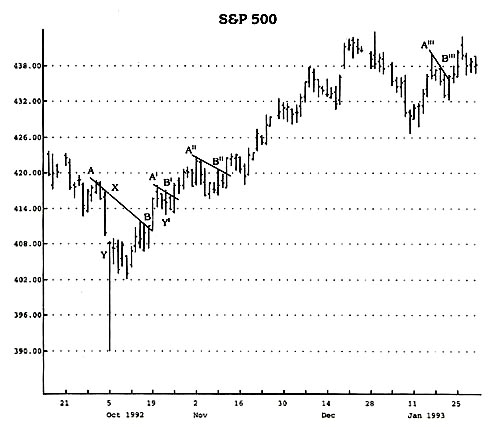
This chart highlights numerous instances in which TD Price Projector 3 yields lower price targets than TD Price Projectors 1 and 2 because the close of the intraday low beneath the TD Supply Line A-B is used.
The major distinction I wish to make relates to the intraday low and the close on the day of the intraday low. By definition, this approach is likely the most accurate in projecting prices because it usually yields the smallest returns. In order to reach the price targets established by TD Price Projector 1, the price objective generated by TD Price Projector 3 must have also been hit. Generally, this same observation applies to TD Price Projector 2, that is, the TD Price Projector 3 price target is realized first. Conversely, to project downside targets given a penetration of an ascending TD Line, the opposite procedure is conducted. The difference between the closing price of the highest intraday high day above the TD Line and the TD Line value immediately beneath it is calculated. Once again, I emphasize the intraday high and the close on the day of the intraday high.
Of the three approaches presented to make price projections, TD Price Projector 3 is the most precise and the most conservative. Through experimentation, you should be able to select the approach with which you are most comfortable. I highly recommend that, regardless of which one you select, you shave one price tick from the high, low, and TD Line when calculating the price projection, to compensate for rounding off and to ensure the likelihood of the price target’s being realized. Specifically, when breaking an up-sloping TD Line, subtract one tick from the high or the close, depending on the method used, and add one tick to the TD Line.