
Your One True Signal for Fast Profits
By: Stephen Bigalow
The following is an excerpt from Steve Bigalow's How to Apply Candlesticks for Profit
A lot has been written through the years regarding Candlestick patterns, especially the Doji pattern. Of all the Candlestick patterns, the Doji pattern appears the most often. The Doji represents ‘indecision’ on the part of traders and it occurs when the ‘open’ (or the first trade of the day) and the ‘close’ (or the last trade of the day) are almost the same price.
The word almost must be emphasized because the open and the close don’t have to be exact. In fact, it’s rare that the prices are exactly the same.
When a stock or an index has been declining and reaches an oversold condition, it’s quite common for these declines to come to an end with the appearance of a Doji. At a market bottom, because a Doji pattern indicates ‘indecision’, it must be confirmed on the following bar by positive price action. If this positive price action results in an open above the high of the Doji bar, it creates a price ‘gap’. We refer to this formation as the Green Flag Doji Gap pattern.
My Green Flag signal is a very simple 2-step process. It starts with the appearance of a Doji pattern when a stock is in an oversold condition. If the open the next day is above the high of the Doji bar, step 2 is complete and my Green Flag is confirmed.
Here is an actual trade:
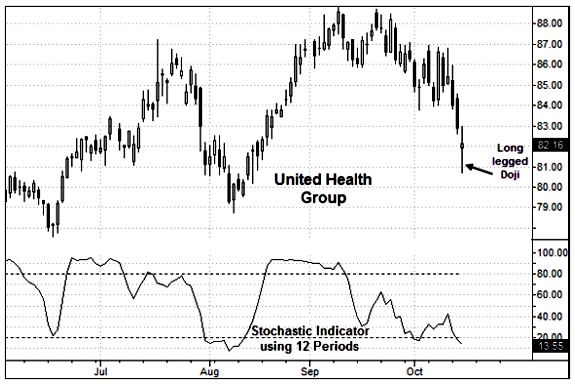
In mid-October 2014, the stock of United Health Group (symbol UNH) suffered a loss of around 10% from the September high. On October 15th, UNH ended the day with what we refer to as a ‘long-legged’ Doji. That morning, aggressive selling on the part of traders caused the stock to open lower and trade much lower than the previous day. As the price traded below 81.00, cautious buyers stepped in and began to buy. As the buying continued, UNH was able to trade from below 81.00 all the way back up to the previous day’s close. But late in the day, sellers reappeared moving the stock lower into the close creating the long-legged Doji pattern.
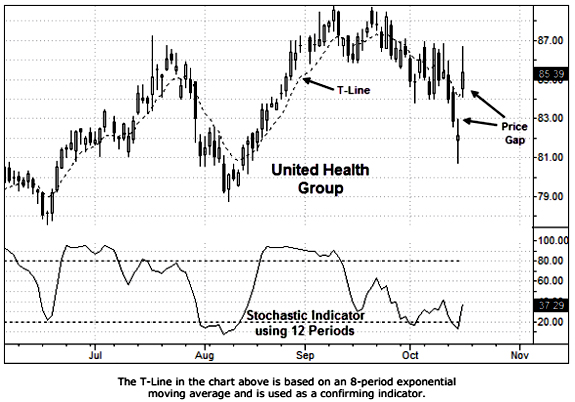
October 16th was a rewarding day for those initial UNH buyers as the stock opened well above the high of the Doji day leaving a very sizeable price gap.
At a price of 85.39, the Doji pattern is confirmed by a close above the open as well as a close above the T-Line.
Two weeks later, our trade is doing quite well.
As long as UNH finishes each day by closing above the T-Line, there’s no reason to close out the trade. In the chart below, we can see that the T-Line does a very effective job as a ‘trailing stop’. As the price moves higher, the value of the T-Line moves higher locking in more of our profits.
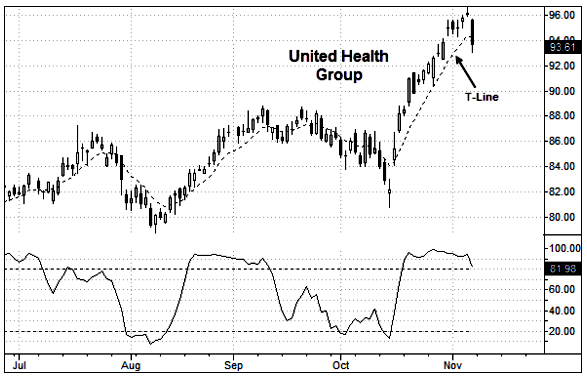
Finally, on November 7th, as the stock closes below the T-Line our trade comes to an end at a price of 93.61.
Let’s take a look at the choices for our trade:
We could have bought the stock at a price of $85.39 per share and we could have sold it for $93.61 for a gain of $8.22 per share before commission. Our profit in the stock would have been just under 10%. A conservative investment of $597.73 would have allowed us to purchase 7 shares of the stock.
Or, we could have purchased a Call option. To get the trade started, just before the close on Oct. 16th, because the stock was trading at 85.39, the 85 strike price is our best choice. As for the expiration month, because the Green Flag pattern is so effective, 4 to 6 weeks is usually enough time for a ‘low risk’ trade. The November 22nd 85 Call was trading at 2.83. At the end of the trade, on Nov. 7th the option was valued at more than 11.00 representing a gain of roughly 290%. Two options could have been purchased for $566.00 before commission.
Or finally, we could have purchased a Debit Spread by buying the November 22nd 85 Call and selling the November 22nd 90 Call. Just before the close on Oct. 16th, the value of this spread was 2.03. On Nov. 7th, the value of this spread was just under 5.00 representing a gain of roughly 145%. Three of these spreads could have been purchased for $609.00 before commission.
Below is a question, but before you answer it, go back and take another look at the three choices listed above. Of the three choices, which trade would have offered the most reward while carrying the least amount of risk?
Before answering, here are a few more things to consider:
If we’d have purchased the stock, our profit before commission would have been $57.54. But if the trade had not worked out and UNH had declined, our stop would have been the low of the Doji bar (or 80.72). Based on an entry of 85.39 and an exit of 80.72, our maximum risk before commission would have been $4.67 per share or roughly 5.5%.
Our second choice would have been to purchase two Call options for $566. Had we made this choice, our profit before commission would have been roughly $1,600. Our stop would have remained the same. We would have closed our trade when the stock reached a price of 80.72. In the case of options, it’s very difficult to estimate what the value of the Calls might have been had the stock traded down to 80.72, but a good guess would be a loss of $350 to $400.
When purchasing Call or Put options, a good rule is to limit your loss to 50% of your cost of purchasing the options. In this case, our exit would have been a price of 80.72 on the stock or a 50% loss of $283 on our option position, whichever comes first.
Had we taken the third choice and purchased three Debit Spread contracts for $609, our profit would have been just under $900. Again, our trade would have been closed when the price of the stock reached 80.72 or if the value of the Debit Spread contracts reached a 50% loss of $304.50.
Now, back to our question. Which trade would have offered the most reward while carrying the least amount of risk?
There’s actually no ‘best’ answer to this question. There are many variables, and each person’s risk profile is different from everyone else.
For inexperienced or very conservative traders, the best answer is choice #1, the purchase of stock.
However, for individuals who choose to purchase options, we prefer choice #3 over choice #2. In our opinion, a properly structured Debit Spread is much less risky than the outright purchase of Call and Put options.
Here are the rules for the Doji pattern:
- The open and the close are near (or very near) the same price.
- The length of the shadow should not be excessively long, especially at the end of a bullish trend.
- A Doji Gap occurs if the stock or index is in an oversold condition and the next day the open is above the high of the Doji.