
Wedge Patterns and Earnings Announcements
By: Rob Roy
The following is an excerpt from Rob Roy's Options Axiom Rules
A stock may consolidate into a wedge pattern as it gets closer to an earnings announcement. Traders may be holding back making trades while they wait for the earnings information to be released. The earnings announcement date is known well ahead of time in most cases. Even if an exact date is not known, companies must report their earnings information quarterly (about every three months). It is well known that earnings can be a big movement event for a stock. Floor traders know this well. In the weeks approaching earnings the implied volatility increases in anticipation of this event. If the earning information is good, then a stock should go up. If the earnings information is bad, stock should go down. It’s just not that simple. A company can have stellar earnings and the stock can drop significantly when this news comes out (or vice versa, the stock increases significantly on bad earnings). There are other factors that come into play such as guidance, expectation, quarter-to-quarter comparison, year-over-year comparison, and trumping all of these is the public expectation and view points. Regardless of any of the fundamental information, the general public’s view (in this case trader’s) of the stock rules all. Typically, if the general public is bearish, down the stock goes, if the general public is bullish, up goes the stock. This is an oversimplification, yet the point still remains.
Let’s get back to the floor traders: If a stock typically moves big around earnings the floor trader raises the implied volatility. The direction that the stock will actually move may not be known, but a rough idea of how much it will move can be created. The implied volatility is up due to the “unknown” of the event. Once the earnings announcement is made, the “unknown” of the event is removed and the implied volatility is taken out quickly. An example of this is shown below.
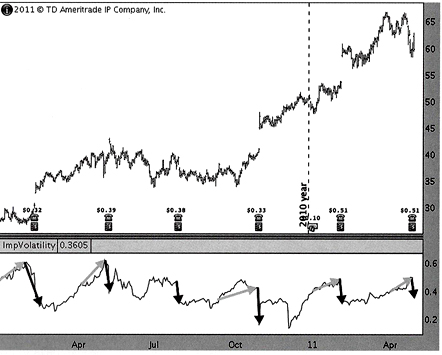
This chart shows a stock that typically moves on its earnings announcement. Below the stock chart shows the average implied volatility for that stock. The lighter colored arrows (which are green on the computer screen) show implied volatility increasing just before the earnings event. The rise in implied volatility is making the options more expensive. This is called a volatility rush. The pictures on the chart of the book and the phone are the actual days of the earnings announcement. You can see via the darker colored arrows (which are red on the screen), that as soon as the earnings information is known, the implied volatility of the stock drops significantly. This is called a volatility crush. This stock is making some fairly large price moves from the earnings announcement, but often this is secondary to what implied volatility can do to the profit and loss of a Straddle or Strangle.
To summarize what is happening, the Straddle and Strangle traders are buying “expensive” calls and puts going into earnings, and turning around and selling them “cheap.” No trader can make money buying expensive and selling cheap. In fact, despite some of the large moves the stock itself made the Straddle and Strangle traders would have chosen losers.
This is a perfect example of when a trader might use wedge patterns to identify edge in their trade and not the event of an earnings announcement. Should the trader find a clean wedge pattern, with reasonable implied volatility levels, and earning is coming up in the near future, consider it a bonus for the trade and adjust the trading plan accordingly.