
Cyclic Data in the Form of Waves
By: Steve Swanson
The following is an excerpt from Steve Swansons Market Turning Point Trading
Some economic data obviously has greater influence during certain times of the year and the month as well, and may even have a more dramatic impact based on a potential “surprise” factor created by its numbers.
My Market Turning Point (MTP) trading system has advanced analysis that shifts through market data and measures combined economic influences. We use those to help investors understand their combined effect on the market’s movement in upcoming days, weeks, and months.
Let’s consider a graphical representation of how some of those economic reports might influence the markets. Imagine a sine wave that represents quarterly earnings in a very simple way: during the month and a half leading up to that report (issued every 3 months), we would expect a rising wave of anticipation of those results. For now, we won’t consider the actual report results, just the anticipation of the release of that report. After the report is released, its influence gradually declines. Results that were previously speculation become known, actionable facts as anticipation is replaced by hard data. That anticipation/reality cycle repeats for each successive round of quarterly reports.
Here’s a second influence, demonstrated in the chart below, reflecting a one-year period of 220 trading days. The cycle of the Federal Reserve meetings occurs approximately every 60 days. It’s a very important data point because the board of Federal Reserve Governors makes a decision as to whether or not to adjust interest rates.
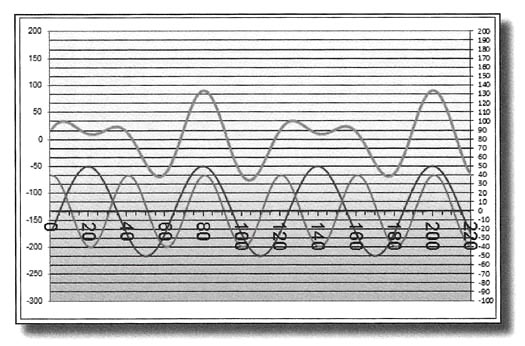
We know the announcement date for Fed statements varies, but for the purpose of this example we’ll consider those to occur every 60 days. The anticipation effect of their actions will precede the actual announcement.
Also, you can see the times on the chart when both cycles simultaneously peak at precisely the same time, day 80 and day 200. In a bull market, the period leading up to those peak dates may become especially strong, while in bear markets they may become particularly weak.
Following the Fed statement, anticipation about potential actions quickly subsides. Investor memories are short and the anticipation of the data can create a stronger market move than the actual news. Thus, the adage “buy the rumor, sell the news” really does have a kernel of investment truth to it.
If we were to summarize the influence on both cycles in sum, we would see a combined line showing the most influential times they would impact the financial markets. We can also see lesser periods of influence too by noting the dips.
Another factor is cyclical magnitude. It reflects the underlying strength or power of that influence. For example, what if interest rates were at an all-time low and markets were very bullish, but there was a strong expectation that the Fed was about to start raising rates in a significant way?
In that case, the fear of higher rates would have a stronger influence on investor anticipation than if the Fed had previously stated that rates would not be raised for the foreseeable future. Thus, the magnitude of that influence would be stronger than in previous cycles. That would skew the summation line even more.
As you can see, market movement is not as random as you might have expected or even observed first hand. Periods of influence related to economic data are important explanations for markets undulation, and why these undulations occur with such a great degree of regularity.
That complexity is what makes observing cyclical influences in the markets so difficult. You can’t simply eye-ball a chart and estimate how which underlying influences are really affecting price movement over time.
On the chart below, you can see how important highs and lows tend to correlate with the longer cyclical influences arising from the theoretical interest rates and earnings periods we used to create it. But that theoretical action holds true in real market movements too.
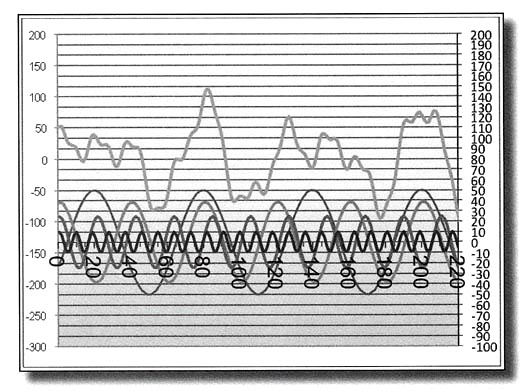
Longer timeframe influences, such as interest rates, will always have a stronger influence on the markets. The basic rule of thumb regarding that influence is this: The longer the cycle’s period, the larger its amplitude (power).
Some technical tools can moderately help locate cycle lows or highs but miss them during trending periods, or when there is a lot of market chop. That’s because most technical indicators available to traders are rehashed “price-based” analyses that end up filtering out the most important aspect of market movement: Movement charted over time.
In truth, even if the “amplitude” of powerful market influences like interest rates were reduced, the “when” of market peaks and troughs would still prove to be critical knowledge for investors.