Advance - Decline Trading Pattern
By: Laurence A. Connors and Blake E. Hayward
The following is an excerpt from Investment Secrets of a Hedge Fund Manager
The Connors-Hayward Advance-Decline Trading Pattern (CHADTP) is a proprietary indicator we use to identify short- and intermediate-term overbought and oversold conditions for the stock market and the S&P 500 futures market.
As we've mentioned, we are big proponents of trying to identify trend reversals. The biggest profits come from the times one can be a buyer at market bottoms and a seller at market tops. The CHADTP is an indicator that helps us identify those market reversals that lead to potentially substantial gains.
Construction of the CHADTP indicator is simple:
- Add the past five day's advancing issues from the New York Stock Exchange.
- Add the past five day's declining issues from the NYSE.
- Subtract #2 from #1.
- Divide by five.
Here are the two rules to trade CHADTP:
- When the five-day reading is above +400, the market is overbought; and when the five day reading is below -400, the market is oversold.
Unfortunately, just because the indicator is -400 does not mean we can blindly buy the market, and just because the indicator is +400 does not mean we should be a seller of the market.
- Whenever we get an overbought or oversold reading, we wait for a specific price reversal before entering. When the CHADTP number is +400 or more, we will sell the market only after the S&P 500 futures trade .10 points below the previous day's low. For example, if we get a reading of +422 and today's low is 453.80 we will take a sell signal only if the market trades at 453.70 or below tomorrow. If tomorrow the market low is 454.60, and the CHADTP is above 400, we will only sell if the market trades at 454.50 or below the next day, and so on.
On the buy side, if today's CHADTP number is -400 or less, we will buy only after tomorrow's S&P trades .10 points above today's high, and so on.
The following examples will help you better understand the application of the rules, but first we need to mention the role the media plays in this trading strategy. As most people know, the newspapers are filled with negative quotes at market bottoms and positive quotes at market tops. You must be extra careful not to allow these quotes to dissuade you from taking the CHADTP signal. As the examples illustrate, the arguments made at these times by analysts and market prognosticators can be very persuasive, but you must avoid being influenced by them.
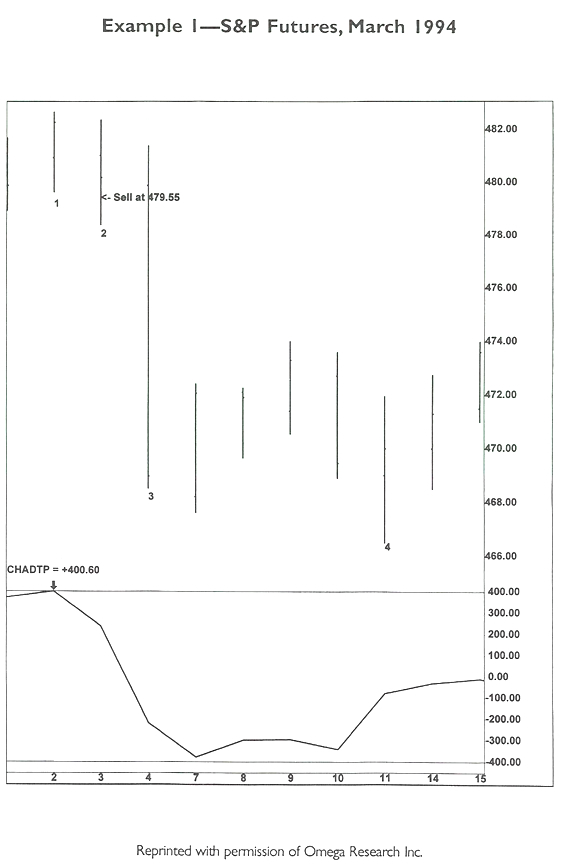
Example #1
- On February 2, 1994, with the market trading at its all-time high, the CHADTP reaches +400.6, therefore warning us that the market is overbought. (Remember all CHADTP numbers are calculated after the close). The following day, if the March contract of the S&P 500 trades .10 points below the previous day's low of 479.65, a sell signal will be triggered.
- Market euphoria is bubbling. The morning papers quote guru after guru proclaiming the market will blast through the 4000 level on its way to 4200. Even so, the market opens lower and begins to sell off. A CHADTP sell signal is triggered at 479.55, .10 points below the previous day's low.
- Sometimes it helps to be a little lucky. One day after our sell signal is triggered, the Federal Reserve raises interest rates for the first time in 3-1/2 years. The market gets crushed (and so do the gurus) and closes down over 11 S&P points and over 87 Dow points.
- Our research has found that the most consistent results using CHADTP occur over a five-to-seven-day period, trade date inclusive. In this case, after six days, the market closes 9.65 S&P points below our sell short signal. (As of December 10, 1994, the S&P 500 has yet to trade higher than the February 2 high!)
This example, though informative, is not quite typical. It is rare to get such a major news event after a CHADTP signal is triggered. You will see in further examples, though, that gains made without news events can be just as significant.
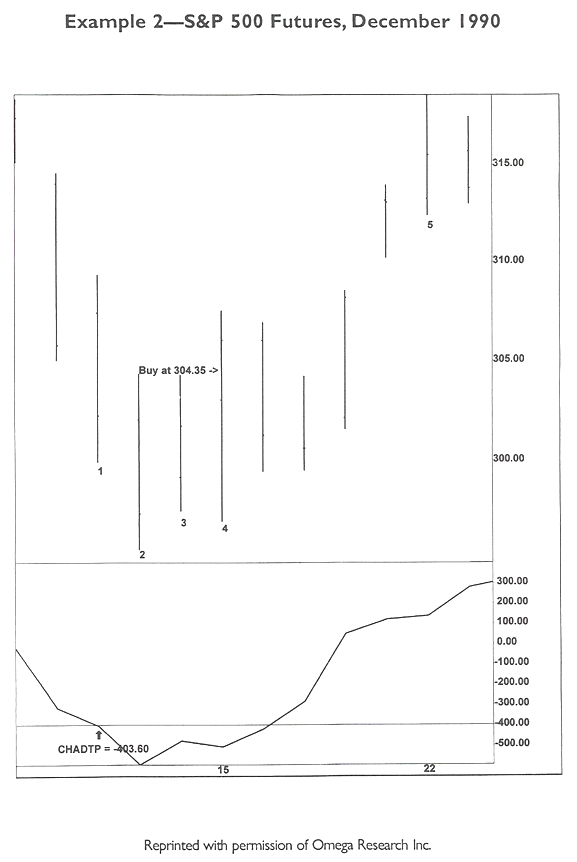
Example #2
- October 10, 1990 – The CHADTP reaches -403.60, warning us that the market is oversold. We know that if the December futures contract of the S&P trades the next day .10 points above today's high of 309.30, a buy signal will be triggered.
- October 11 – The high is not .10 points higher than the previous day's high. We remain on the sidelines.
- October 12 – The high is again not .10 points above the previous day's high. Even though the market closes higher, we remain on the sidelines. We know we are getting close, though. The Wall Street Journal quotes a senior vice president of a money management firm as saying, "This is a scary time."
- October 15. The market sells off sharply in the morning and then reverses. We get our buy signal at 304.35, which is triggered late in the day. We can now be fairly confident that the recent sell-off is over.
- October 23. As mentioned, we have found that the best success occurs by staying in a position for five to seven trading days (trade day inclusive). In this example, over the six-day trading period, the market closes at 315.50, the S&P 500 has appreciated 11.15 points since our buy signal, and the Dow Jones Industrial Average has appreciated approximately 92 points over the same period of time. Futures traders realize a $5,000 plus profit per contract, and stock buyers have entered the market at an intermediate-term low.