
Money Flow Index
By: Adam Oliensis
The following is an excerpt from Adam Oliensis' Stock Chart Analysis & Dynamic Trading System
Money Flow indicators measure the flow of money into or out of a security, based on both volume and rising or falling prices. The particular version of Money Flow we will talk about here is normalized in a way that’s similar to how the Relative Strength Index (RSI) is normalized. Because it measures a specific look-back period (e.g. 14 days), it operates as a kind of volume-weighted momentum oscillator.
In order to make the Money Flow Index (MFI) calculation easier to understand, we have broken it into the following components:
Avg. Price: |
Pavg=(H + L + C)/3 |
Raw Money Flow: |
MF = V * Pavg |
Neg. Money Flow: |
NMF = StatMovTot(MF * IF C>=C[-1] THEN 0 ELSE 1, p) |
|
|
Pos. Money Flow: |
PMF = StatMovTot(MF * IF C<=C[-1] THEN 0 ELSE 1, p) |
Money Flow Ratio: |
MFR = PMF / NMF |
Money Flow Index: |
MFI(p) = 100 – (100 / (1 + MFR)) |
H = high price
L = low price
C = closing price
StatMovTot = the cumulative total
C[-1] = the prior close
P = the period used (most commonly 14 sessions)
The “IF, THEN, ELSE” in the equation returns “data 1” if the test is true (non-zero) or “data 2” if the test is false (0). So, for instance, in the phrase, “IF C>=C[-1] THEN 0 ELSE 1” the ordinary English meaning would be, “If today’s close is greater than or equal to yesterday’s Close, then we’ll use “zero”, and otherwise we’ll use “one”. In the calculation of MFI, using this phrase self-selects whether today’s reading is part of NMF or PMF. The self-selection is done by virtue of using the result of the “IF, THEN, ELSE” as a multiplicand in the equation. If the result is “zero”, then the product of the equation is also “zero” and the appropriate NMF or PMF line remains unchanged.
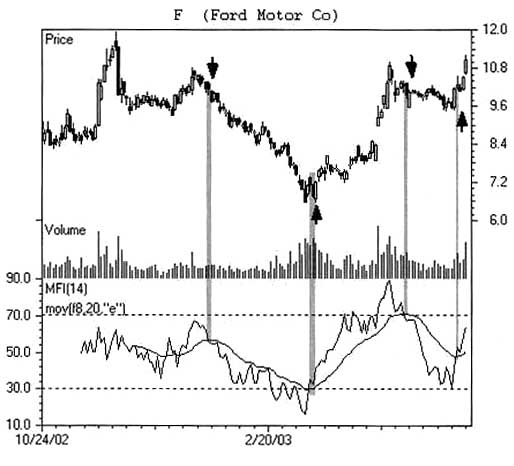
MFI is used in much the same way as is RSI, in that we look for the MFI line to become overbought (oversold), and then we sell (buy) a cross down (up) out of the overbought (oversold) condition.
Looking at the chart below, you can see the MFI line is fairly lumpy. It does a good job of giving us an idea of whether the market is overbought or oversold, but its lumpiness makes it hard to measure precisely when you’re getting a good signal. So, in this case, we added the 20-day exponential moving average (20-dema) of the MFI(14) line to smooth things out. This chart gives you buy signals when MFI crosses up from oversold (over the 20-dema of MFI) and a sell signal when MFI crosses down (below the 20-dema) from overbought.
The number of periods used in MFI greatly affects the line’s velocity and volatility. MFI is best optimized to the volatility of a particular security. Different charts have different rhythms, and trading is often all about finding the rhythm in the chart.
Likewise, if you use a smoothed “Trigger Line” in the way we used the 20-dema above, some degree of optimization is advisable.