
Trading a Unique Occurrence with Options Expiration
By: Rob Roy
The following is an excerpt from Rob Roys Option Axiom Rules Trading Course
For a trader just learning a new strategy it’s often best to walk through a trade that creates a situation that lands “in the gray”, which covers more unique occurrences that may pop up trading in the real world. This gives them a method to safely trade the markets while they gain both experience and skill set. The difference between a good trader and a great trader is not how the “black” and “white” answers are handled. What separates them is how they handle the “gray” answers.
Below is chart of the stock PBR that has formed a wedge pattern. The wedge pattern has been added to help develop and train your eye to seeing it on the chart.
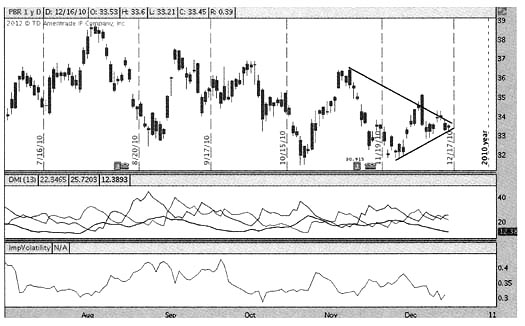
As always, start by validating the wedge pattern using the ADX on the chart (the line in the indicator directly below the stock) to be sure it is below 15. Currently, the ADX is at 12.38 which satisfies that criteria. Looking deeper at the ADX, you can see it is at a typical low point for this particular chart.
Check to make sure the implied volatility is in the lower 25% of the range. To do this, measure from the low- to the high-implied volatility range showing, and check to be sure that it is in the lower 25% of that range. The implied volatility in this example is almost at its low, which is great for us. That shows that the options should be relatively cheap for this particular stock.
The next step is to measure the “mouth” of the wedge to gain an expected price target – bullish and bearish – for this stock. It won’t be possible to gain an exact measurement from the picture of the chart (you will be able to do so in your charting platform), yet a rough measurement will work for the purpose of learning here. The “mouth” of the wedge is about $4.50. With the stock currently trading at a price around $33.50, the bullish target would be $38.00 and the bearish target at $29.00.
With this information collected on the stock chart it is now time to analyze the options to see if there is a viable trade. Below we have the expiration months available in the option chain.
DEC 10 |
(1) |
100 |
JAN 11 |
(36) |
100 |
APR 11 |
(120) |
100 |
JUL 11 |
(211) |
100 |
JAN 12 |
(400) |
100 |
JAN 13 |
(764) |
100 |
Looking at the expiration months available, with the number of calendar days remaining until expiration in parentheses, the choices are not great. The optimum range of days to expiration is between 60-90. APR expiration just fits criteria of not going over 120 days to expiration.
However looking at the DEC, notice how they only have 1 day remaining until expiration. After those options expire the FEB expiration options will be released and start trading. There is a rule in option trading that there will always be the next two expiration months available for trading. At this point there are the DEC and JAN. From there, it jumps to APR options. It would appear that the FEB and MAR options are missing. Once the DEC options expire, the next trading day FEB options will be released. After the FEB option expires, the next trading day the MAR options will be released. Knowing this information is very useful to options traders. This shows that in a couple of days the FEB option will be released with nearly 60 days to expiration.
This creates a situation; if the trader waits a couple of days for the FEB options to be released it is possible that the stock price could break out of the wedge pattern. The question remains, “What is the best decision?” Use the APR expiration with 120 days left, or wait a couple of days to use the FEB options and risk having the stock move. Patience is one of the most difficult skills a trader will have to learn. If the trader waits for the optimum expiration to be released and the stock price moves big before they enter the trade they feel they have missed the trade. This is common when starting out trading. It is easy to say there will always be another trading opportunity, yet it is hard to sit back and wait.
In these scenarios, when there is a situation showing that the best choice for the expiration selection happens in a couple of days, the trader can analyze the trade using the further out expiration month to see if there is enough room to profit on trading using those options. In this case, there would not have been enough room to profit using the APR expiration options. That means that the trader should wait a couple of days for the FEB options to open up. If the stock moves too much in that time, pass on the trade and wait for the next one.
Below is a stock chart a couple of days later after the FEB options have started trading. A quick review of the chart shows that the stock really has not made a significant break out of the wedge pattern, and the ADX and implied volatility still meet the criteria. A trader may consider re-drawing the wedge pattern on the chart. However, doing so will not change the important part of the wedge. The important part being the “mouth” of the wedge that is used for creating a bullish and bearish target.
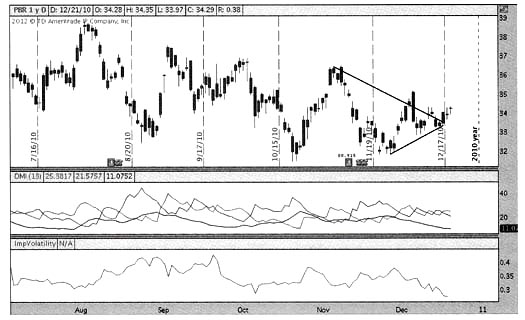
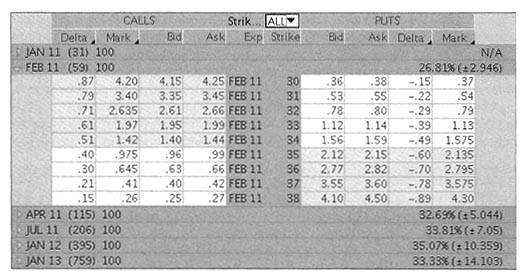
With the opportunity on the chart still a viable candidate, move onto the option chain pictured below to analyze the options for a valid trade. Looking at the option chain, the FEB expiration options now have 59 days to expiration, which is optimum for trading this technique.
Understand that the wedge pattern appearing to the trade on the chart and the option expirations not matching is important. When this happens, the trader can either analyze the farther out expiration to see if the trade has enough room to profit, or simply wait for the optimum months’ expiration to start trading. Neither answer is wrong. It is up to the trader to decide with which they are more comfortable.