The Oscillator
By: Lee Gettess
The following is an excerpt from Lee Gettess’ Trading in the Trenches
Sometime in the mid to late 1980's, I was first introduced to the concept of using a price oscillator to measure the underlying momentum of the market. A trader named Tom Joseph utilized a 5/35 oscillator to help him identify the correct Elliott Wave sequence on the chart he was working with. Well, Elliott has so many alternate counts that I never had a clue what the wave structure really was, but I did like the way Tom used the 5/35 oscillator. 5/35 means that you take a five period moving average and subtract it from a 35 period moving average. Whether you use closing prices, average prices, or midpoints doesn’t change things much, so I tend to use the closes. The difference between these two moving averages is then plotted below your price chart. As with all of the indicators we will be using, most commercially available software packages have the ability to do this as part of their standard equipment.
The best signals occurred when there was divergence between price and this 5/35 oscillator. That is, if price made a lower low than the previous swing low, but the 5/35 oscillator was higher than the reading at the previous swing low, that often indicated a market about to reverse to the upside. Divergence at the highs often was a warning of an impending sell off.
What we are going to do is create an oscillator that is a 25 period moving average subtracted from a 175 period moving average. I use exponential moving averages to save computation time. We also will plot a 20 period moving average of the oscillator itself. What this accomplishes is to give us a proxy for what a 5/35 oscillator looks like on a time frame that is magnitudes greater than the time frame we are trading. For instance, if we are trading a daily chart, the 25/175 oscillator will approximate what a 5/35 looks like on a weekly chart. A 25/175 on a 5 minute chart mimics the 5/35 on a 25 minute chart. The exact time frame doesn’t matter…the 25/175 oscillator reveals what the 5/35 looks like on a time frame that is higher by a factor of five.
Now for you mathematicians and purists, I realize that a 25/175 doesn’t exactly look the same as 5/35 does on the higher time frame. The math does differ slightly, but it is close enough for government work. That is, it reveals enough to us that we can make good use of it as a filter.
So, we create a 25/175 period oscillator from exponential moving averages of the closes, then we also plot a 20 period moving average of the oscillator. What are we going to do with it? Well…you probably figured that it was going to be a filter to give us trade direction, and so it is.
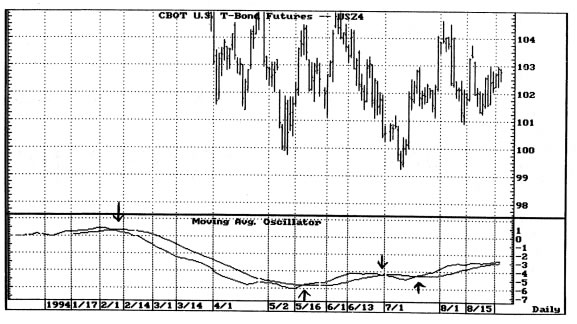
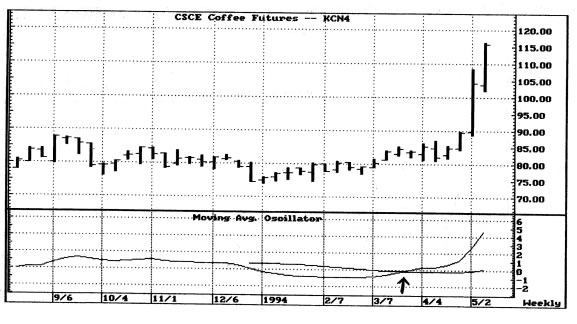
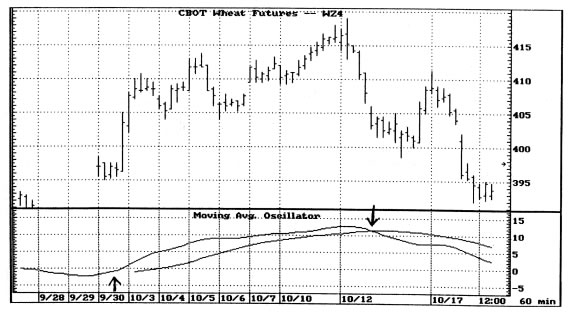
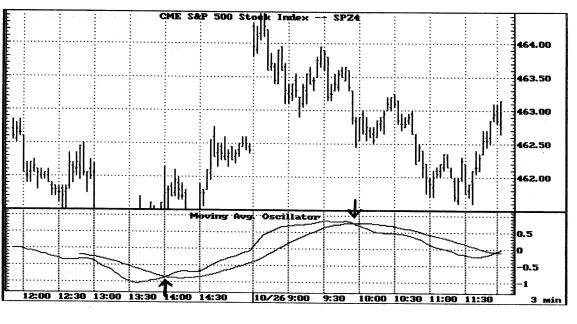
Whichever side of its own moving average the oscillator is on will be our clue as to trend direction on the higher time frame. If the oscillator is above the moving average, we will only want to be buyers. If the oscillator is below the moving average, we want to be sellers.
The very best signals will occur when the oscillator shows a divergent high or low, then crosses over the moving average.
Examples below will show the oscillator signals. Pictures are supposed to be better than words, right?


