
Trend Factors
By: Thomas DeMark
The following is an excerpt from Tom DeMark's The New Science of Technical Analysis
Often, both traders and investors preoccupy themselves with market rhetoric. As far as I am concerned, however, one distinction they fail to recognize or to acknowledge is the difference between the duration and the degree of price moves. Invariably, if I were to ask for definitions to widely used market terms such as short, intermediate, and long term, I would wager that most, if not all, would respond in temporal terms. Although the responses might vary somewhat, I would expect to hear that short term relates to moves of less than one month’s duration, intermediate term to moves longer than one month but shorter than six months, and long term to moves lasting more than six months. These labels may have been appropriate prior to the 1980s, but because of increased volatility in the financial markets, they have become outdated.
Moves that in the past consumed weeks or months are being fulfilled in days or hours. Because of market illiquidity, the speed of news dissemination, the herd instinct of fund managers and other factors, this trend continues. Consequently, I apply the descriptions of short, intermediate, and long term to percentage price movements rather than to specific time intervals. For example, I consider moves of less than 5 percent to be short term, moves of 5 to 15 percent to be intermediate term, and moves greater than 15 percent to be long term. These definitions apply regardless of the time required to accomplish these moves. In this context, I rely on an analytical tool I developed many years ago to forecast the inception of trend moves of an intermediate to long-term variety. I refer to the set of specific ratios I use as Trend Factors™.
In the early 1970s, I observed a dominant tendency for various markets to exhibit support and resistance at price intervals defined by percentage retracements from preceding price peaks and troughs. For example, upside resistance levels were projected by multiplying a recent low by a series of prescribed ratios. Conversely, downside support levels were calculated by multiplying a recent price peak by the inverse of the upside ratios. Through a tedious trial-and-error process, I was able to approximate the ideal ratio values. I established prerequisites to qualify the reference highs and lows and to ensure consistency and uniformity. The selection criteria necessary to identify the correct reference value – whether high, low, or close – were critical to defining the price trend and the anticipated price movement.
In order to define it, a reference low must first be qualified. Because the minimum Trend Factor ratio is .0556, a qualified low exists once price has declined to a value at most .9444 from a previous qualified reference high day’s close. In the chart below, you can see that from point B to point A, price declined more than .0556 – in other words, the value of point A is no more than .9444 times the value of Point A. This validates point A as a Trend Factor low. Price X is the 1.0556 level and price Y is the 1.112 level.
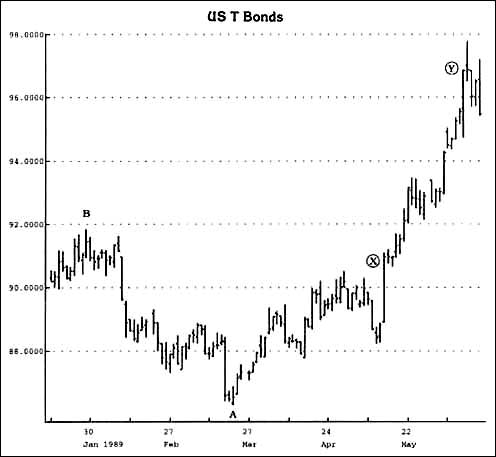
Conversely, a qualified high exists once price has advanced the minimum Trend Factor 1.0556 from a pervious qualified reference low day’s close. It’s that simple to select price points that qualify.
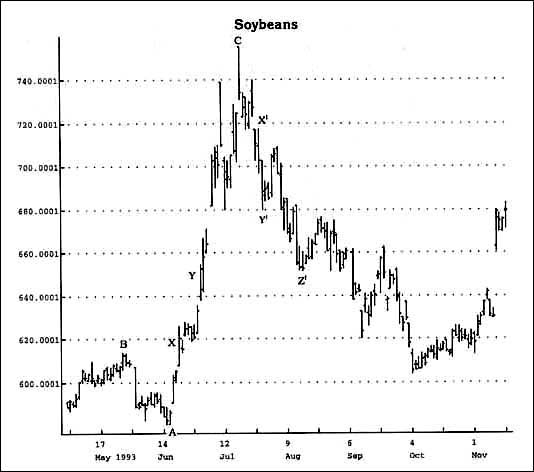
In the following chart, point A is no more than .9444 point B and is qualified as a reference point. Price levels X and Y correspond to 1.0556 and 1.112 Trend Factor objectives. Point C qualifies as a Trend Factor high reference point because price advanced from point A by more than 1.0556.X’ and Y’ identify Trend Factor objectives, as does Z.
Before getting too specific, I’d like to introduce you to the concept of Trend Factors™. There appears to be a critical juncture in price movement, at which point, once price momentum surpasses on a closing basis key support or resistance levels, it is able to proceed to the next critical juncture. The market itself legitimizes those price moves. An alert trader can capitalize on the message the price movement sends once it exceeds these critical price levels. Both of the charts above demonstrate this phenomenon. As identified earlier, the essential ingredients are the qualification and the selection of the reference point and then the Trend Factor ratios. To determine the first level of resistance upside, the reference point must be multiplied by 1.0556; to arrive at the second level of resistance upside, the reference point must be multiplied by 1.112 (2 X .0556); and to calculate the third level of resistance, the reference point must be multiplied by 1.14 (2 ½ X .0556).
On the other hand, to determine the first level of support downside, the reference point must be multiplied by .9444; to arrive at the second level of support downside, the first downside target must be multiplied by .9444 again (this is different from the upside process); and to calculate the third level of support downside, the second level must be multiplied by .9722 (1/2 of value between .9444 and 1.000).
It is important to select the proper reference price value, to ensure that the support and the resistance levels are defined accurately. My research has confirmed that specific patterns identify what price to use to calculate these threshold levels. Specifically, if (1) the reference day’s close is less than the close one day earlier, and (2) the close one day before the reference days’ close is less than the close two days earlier, and (3) the close one day after the reference day’s low is greater than the reference day’s close, then the upside resistance level and projection values are determined by multiplying the reference days’ low by the ratios.
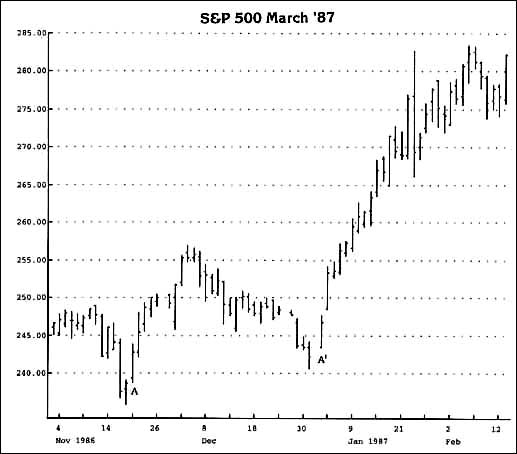
If either the reference day’s close or the close one day before is an up close or an unchanged close, then the reference price used to calculate the first resistance level is the reference day’s close. The only exception arises when the low the day after the reference day exceeds the close of the reference day. In this instance, the first level of resistance is determined by multiplying the close on that day by the ratio 1.0556, as shown in the chart below. The second and third levels of resistance are calculated by using the reference day’s low. In this chart A and A’ identify days after reference lows in which price gaps exist – the low fails to intersect the previous day’s close. Consequently, the Trend Factors are multiplied by the closes on these days.
When defining the first level of support, as well as the next two levels of downside price projections, a similar evaluation of closing price relationships must be done. If the close of the reference day, as well as the close prior to the reference day are up closes, then the high of the reference day is used to project the critical support level. The second support level is projected by multiplying the first support level by .9444. The third support level is .9722 times the second. If either the close the day before the reference day or the close the day of the reference day is a down close, then the same ratio is multiplied by the reference day’s close. The only exception arises when the high the day after the reference day is less than the reference day’s close. In this instance, the first level of support is determined by multiplying the close that day by the factor .9444. The second and third levels of support are calculated by using the reference day’s high.
Generally, the first attempt to exceed level one, established by the low or the high multiplied by the Trend Factor is accomplished easily. However, in those instances where price exceeds the projection and closes in the direction of the trend but fails to close above or below it, the next trend factor objective is reduced by 50 percent – specifically, level two price projection is 1.0834 and .9722. These exceptions apply only when price confirms level one intraday but not on a close.
One exception to those rules does exist. Due to the fact that some futures’ markets are quoted in decimals such as the currencies, and are not preceded by any whole numbers, it is important to adjust the Trend Factor™ to include another prefix - .99444 instead of .9444 and 1.00556 instead of 1.0556.
I have found that the support and resistance levels projected by utilizing Trend Factors™ are often uncannily exact. It is not uncommon to witness price approach a level or even exceed it intraday, only to then fail and reverse trend at precisely the Trend Factor ™ level. Conversely, once a defined level is exceeded on a closing basis, price generally proceeds to the next level. The keys to success when using this approach revolve around the selection of reference points and the proper implementation of the Trend Factors™.