
Breakout or Fakeout?
By: Duane Davis
The chart below shows Tuesdays performance after a Monday holiday. In this chart, we can see that when Friday closes in the upper 1/3 of the trading range, Tuesdays have a tendency to gain around 40% of the 5-day average range. In the year 2002, before commission, a gain of 40% of the 5-day average range would have been the equivalent of a gain of around 8.00 points for $2,000 in the regular S&P and around $400 in the e-mini.
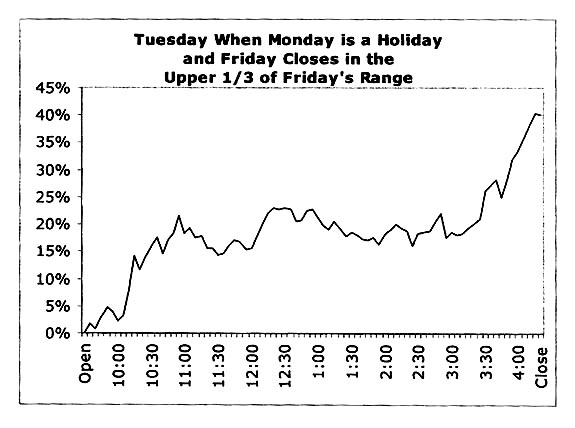
The best way to trade this type of a day is with a breakout buy strategy. In looking at the chart above, the percentage at the left represents the 5-day average range. We can see, that as a general rule, under those conditions by the time the S&P 500 Futures has traded around 10% of the 5-day average range above the open of the day session, its likely that the S&P has shown its hand. In other words, this value is a point where the market has more or less committed itself for the day. To get a better appreciation of what we mean by a breakout buy day, lets take a look at the next illustration.
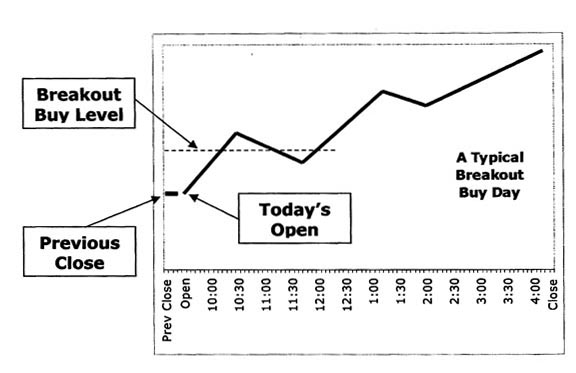
During a successful breakout buy day, the market trades through the breakout buy level and closes higher.
A fakeout day on the other hand, occurs when the market trades in one direction and then suddenly reverses. The chart below illustrates a typical fakeout buy day.
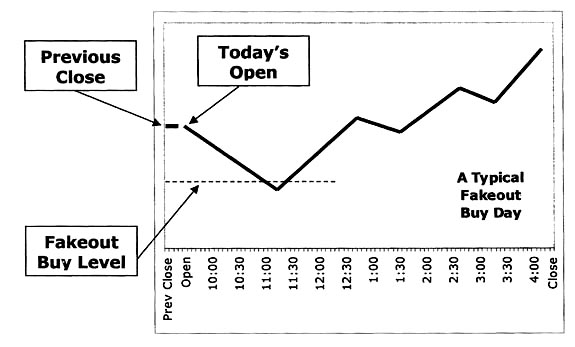
Fakeout days occur much more often than breakout days, but they’re more difficult to trade successfully. An example of the best time to apply a fakeout buy strategy would be the day after an ‘extremely negative outside day’ when the Trade for a Living Oscillator is below 40.
The Trade for a Living Oscillator measures short-term overbought and oversold conditions using the simple formula below:
Highest Price in the last 5 Days – Open 5 Days Ago = X
Last Close – Lowest Price in the Last 5 Days = Y
(X + Y) x 100
(Highest Price in Last 5 Days – Lowest Price in Last 5 Days) x 2
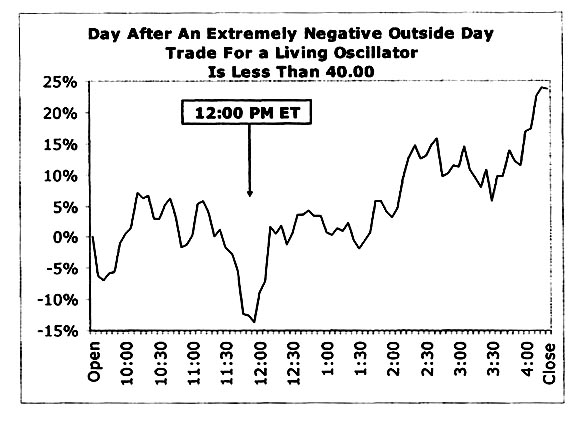
Looking at the chart above, an extremely negative ‘outside day’ occurs when the S&P 500 futures opens above the previous day’s high and closes below the previous day’s low. When this type of an outside day occurs, the market has earned a well deserved rest. Therefore, it’s not unusual for the S&P 500 futures to trade lower during the early part of the day. In this chart, we can see that after a few hours of trading, the market is often around 10% of the 5-day range below the open of the day session. Because we’re aware of the psychological effect of an extremely negative outside day, a low risk fakeout buy trade could be initiated once the market has met these conditions.
As day traders, it’s important that we leave ourselves enough trading time to make a profit. There’s no point in entering a trade that only has a few minutes left. Remember, we not only have to make a profit on the trade, we also have to earn enough to pay the commission. As a result, we prefer not to enter a new trade during the last 45 minutes of the day session. On a full trading day, this would be the equivalent of 3:30 pm ET. Be careful around holidays, as it’s not unusual for the market to close early during some holiday periods.