
Fibonacci Ratios
By: Duane Davis
The following is an excerpt from Duane Davis' DIY Success Package
The Fibonacci number sequence is a mathematical cycle that incorporates the expansion and contraction of all elements in nature, from the growth of the smallest leaf on Earth to the largest galaxy in the universe.
The Fibonacci number sequence was named after Leonardo of Pisa, also known as Fibonacci. Although this number sequence had been described earlier in the 6th century AD by the mathematician Virahanka, it’s best known today as The Fibonacci Sequence.
This cycle beings with the number 0. The next number is the number 1. Each following number is the sum of the two preceding numbers. To arrive at the third number in the sequence, the preceding two numbers are added together and the result is 0 + 1 = 1.
The fourth number in the sequence becomes 1 + 1 = 2.
The fifth number is 1 + 2 = 3.
The sixth number is 2 + 3 = 5.
The seventh number is 3 + 5 = 8.
The eighth number is 5 + 8 = 13.
There is no end to the sequence, it goes to infinity.
Here are the numbers that start the Fibonacci Sequence:
0, 1, 1, 2, 3, 5, 8, 13, 21, 34, 55, 89, 144…
After the first few numbers in the sequence, if you measure the ratio of any number to that of the next higher number you get .618. For example, 34 divided by 55 equals 0.618.
If you measure the ratio between alternate numbers you get .382. For example, 34 divided by 89 equals 0.382.
For most traders, these are the important ratios:
0.236, 0.382, 0.500, 0.618, 0.764, 1.000, 1.382, 1.618
Traders use the Fibonacci retracement levels below 1.000 as support and resistance levels. Numbers above 1.000 are used for taking profits. Due to the fact that many traders may be placing buy and sell orders at these levels, prices will usually stall or even reverse direction.
Let’s take a look at how these retracement levels are used.
In the chart below of the GBP/USD, the market rallied from a low of around 1.99 to a high of just over 2.10. Then, during a pull back, the market reversed at the 0.500 retracement level (or 50%) at just under the price of 2.05.
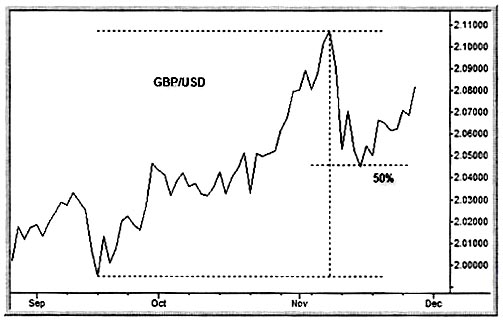
You may be asking yourself, what about the other levels on the way down to 50%. Why didn’t this market stop at the 0.236 level or the 0.382? Well, unfortunately, nothing is perfect and Fibonacci retracements should never be used alone. They can be a useful tool when combined with other technical indicators.