
Intraday Reversal Times
By: Oliver Velez
The following is an excerpt from Oliver Velez's Swing Trading Home Study Course
Anytime I am talking to a group of people that are not pristine traders, I will ask how many of them are familiar with intraday reversal times. I estimate less than 10% of the people raise their hand on average, and those that do are only familiar because they remember reading about them in Tools and Tactics for the Master Day Trader. When I tell the group that I consider trading intraday without being intimately familiar with these times a ‘huge disadvantage’, most people get interested.
Reversal times are times during the trading day that the market is likely to stall or reverse the most recent pattern. They can occur because of the way Wall Street functions, and because of market maker or specialist activity. For example, at 3:00 PM EST, the bond market closes. The remaining hour of the stock market may take a direction based on the finality of having bonds closed.
Another example is during the first five minutes of the trading day, from 9:30 – 9:35 AM, EST. During this time the public’s orders to buy and sell ‘at market’ are being handled by market makers and specialists. It is not unusual to see big swings in a stock’s price during the first 5 minutes. A high or low may be set in the stock’s price that lasts for most or even all of the trading day.
Yet another example is the beginning and ending of lunch time. The reason is as simple as the fact that the market makers and specialists go to lunch, leaving junior people in charge to watch things while they are gone. Not only does this lead to reversal times going into and out of lunch, but also a phenomenon known as the ‘doldrums’, where you will find on most days, breakouts and breakdowns will fail during the lunch doldrums.
The list of times that should be watched are as follows, all Eastern Standard Time (EST): 9:35, 9:50 - 10:10, 10:25 - 10:35, 11:15, 12:00, 1:30, 2:15, 3:00, 3:30. Of these, the major ones to watch are 9:50 – 10:10, 11:15, 1:30, 2:15, and 3:00.
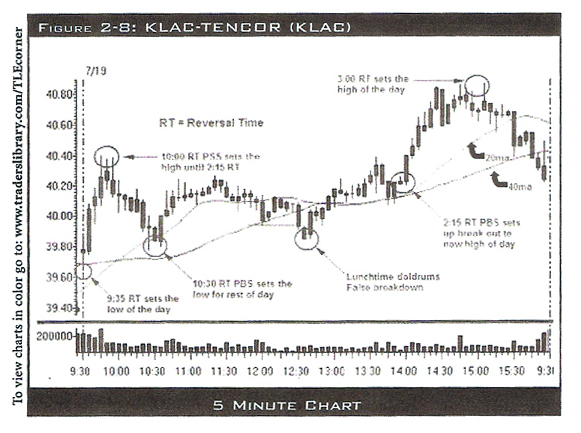
The following 5-minute chart of KLAC will show an example of these areas. The 9:35 reversal time (RT) sets the low of the day. The sell set-up occurs at 10:00 which sets a high of the day that lasts until 2:15. It is not uncommon for traders to purchase during the first 5 minutes and sell into the 10:00 RT. Notice that the ‘lunchtime doldrums’ delivers a ‘false’ breakdown, which is expected. That leads to a slow rally that challenges the high of the day. The pullback from that rally, now out of the doldrums, sets up a buy set-up at 2:15 RT. This leads to a powerful break out, and a new high of the day. Naturally, that rally ends at 3:00 RT, which marks the high of the day. The high of the day, the low of the day, the two next biggest pivots, and the best buy set up all happened at reversal times.
Pull up your favorite charts or the market itself and notice the times listed above. It is not that every reversal time will have a major market move, but notice the major pivots, highs and lows in a stock’s price every day and you will be amazed how often these major moves happen at or within one five-minute bar of a reversal time. Just notice how often a 10:30 reversal time has set the high or low of the day in the recent market. The importance of the various times may change some in different market environments, but if you time your strategies with key reversal times, they will be all the more effective.