Fibonacci Retracements and Extensions
By: Jea Yu
The following is an excerpt from Jea Yu's Trading Full Circle
Most technical analysts extensively use some sort of ratio analysis for potential entry and exit strategies. The application of Fibonacci numbers to this ratio analysis lead to terms like Fibonacci retracement, or Fibonacci extensions, etc. Financial markets exhibit pullbacks and extensions with enough frequency that Fibonacci retracements to ratios like 38.2%, 50%, or 61.8% have become common jargon in a trader’s language.
The backbone behind Fibonacci studies is made up of the price retracements and extensions. The study of these retracements and projections enables traders to identify price swings and support & resistance areas.
Markets demonstrate repetitive patterns where prices oscillate between one set of price ratios to another, making price projections possible. Market trends can be defined by geometric relationships as they exhibit harmonic relationships between the price and time swings. Markets also form cycles around the price and time levels. Many investors and traders use cycles and harmonic relationships to project future price swings and times.
Each price swing consists of high and low prices and many bars in between them, followed by a reversal swing consisting of the same high and low prices, but in the opposite direction. If the prior swing is an up swing, then the following down swing is a reversal swing, or retracement. A high swing occurs when the current high bar has a lower-high bar before and after. A low swing occurs when the current low bar has a lower-low bar before and after.
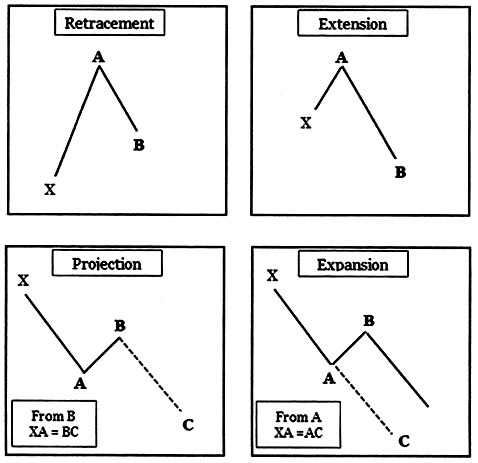
Fibonacci retracements and extensions, as illustrated below, offer key support and resistance areas. Here are some definitions of retracements and extensions:
- Retracements: Retracement is defined as when a price re-traces a portion of the prior swing. This portion could be defined in Fibonacci ratios like 0.38, 0.5, or 0.618.
- Extensions: Extensions occur when the price expands the entire prior swing (100%) and travels beyond the entire swing. The extension swing could be 127% or 162% of prior swings.
- Projections: Projections are defined as when price extends away from a completed retracement swing in the same length (or more) as the first swing.
Symmetry and Confluence
Gann, Fibonacci, and Elliott all studied market symmetry and found valid theories. These patterns exist in all forms in nature and certainly exist in the markets. One of the best ways to confirm symmetry in the markets is to check price and time using two or more cluster confirmations. Another key method to compute these patterns is to use percentage change of price between market highs and market lows. Symmetry is a science by itself, and traders take great advantage of knowing the potential turning points and levels using these methods.
Symmetry is visible in all markets and in all time-frames. Symmetric rallies and declines give traders an advantage to determine the key turning points. A cluster of similar extensions and similar retracements at key price ranges, or some important levels provide insights into the future significant resistance and support levels. In addition to knowing key turning points, the benefits of trading symmetric price and time cluster levels include low-risk trades.
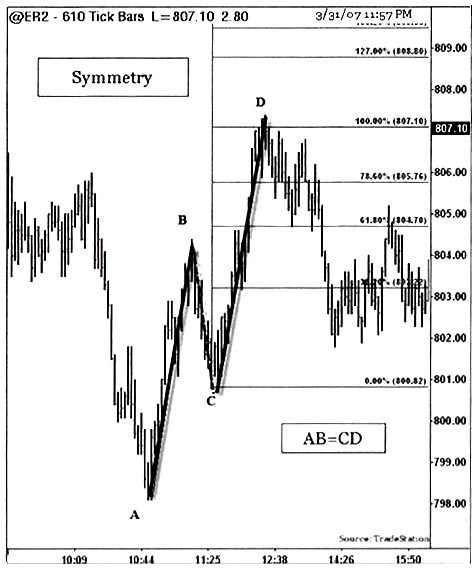
The chart below illustrates the symmetry pattern from the Russell 2000 futures (ER2) 610 tick chart. Symmetrical swing lengths are shown after a 50% retracement at BC swing. Market symmetry of 100% extension is expected after a retracement of less than 50% retracement levels. If the retracement exceeds 50%, the extension may be less than or equal to 100%.
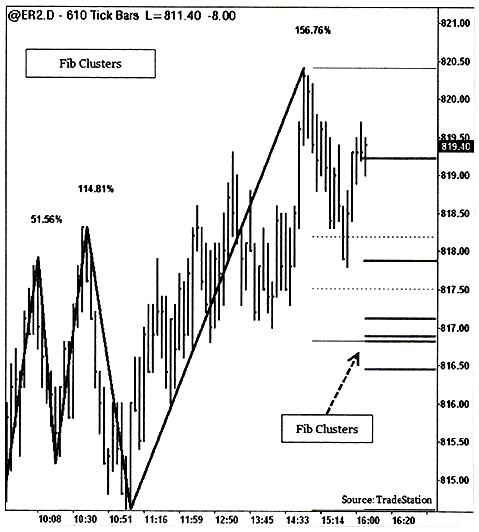
Confluence of multiple Fibonacci retracement or extension levels signifies a stronger area of support and resistance. The confluence of multiple Fibonacci retracements in a fairly tight area is computed using prior swings of both retracements and extensions with certain criteria. Then each Fibonacci retracement or extension level is grouped to generate a confluence within some threshold to find Fibonacci clusters in an area. These cluster levels are more significant than a single Fibonacci retracement itself. The traders are either initiated or closed at these confluence levels.
The chart below shows Fibonacci confluence or clusters of various levels.