
Zooming Down
By: Oliver Velez
The following is an excerpt from Oliver Velez's Swing Trading Home Study Course
“Zoom” is short for zooming down. It is a term we use that refers to going down one timeframe to find an alternate entry to play. For example, on a daily chart swing trade you go down to the hourly chart to find an entry. This alternate entry could be one that occurs after the larger time frame (daily in this case) entry hits, and you are playing the first pullback. It can also be used before the longer time frame hits. In this case it would be called ‘anticipatory’ because you are entering before the real play even hits.
There are advantages and disadvantages in doing this. (Isn’t that always the case?) In general, anytime you go down a time frame for an entry, you are looking to improve the reward-to-risk one way or another. The disadvantage is that you may enter a play early (when anticipating) that never should have been entered, so you suffer a stop that you would not have, had you waited. Or, when playing the first pullback, you may miss the play entirely, as the stock may never pullback.
Which is best? Well, it depends. It revolves around your intentions and style. Many people often zoom down too much and miss the play, to their detriment. If they wait for the first pullback, it never comes or they can’t find the entry. If they anticipate, they stop out on their smaller time frame, but the play succeeds on the bigger one, the one they should have been playing.
If your trading plan requires you to be involved in serious swing trades, it is usually best to play them by the book. It will also revolve around how you feel about having to enter the same trade 2-3 times when stopped out at the first attempts. Some people can’t do that from a psychological point of view, some accounts can’t afford the extra commissions. This is sometimes required when zooming down. Some people take the attitude that ‘legging’ into a swing trade during the day and holding it if it is doing well is the way to go. Here, a zoomed down entry is the answer.
Here is an example of a ‘triple zoom’. Why would you do this? It may be used as just a great way to align multiple time frames. As in the example below, perhaps you are not even interested in the swing trade. But what better day trade is there than one that is in a swing trade mode?
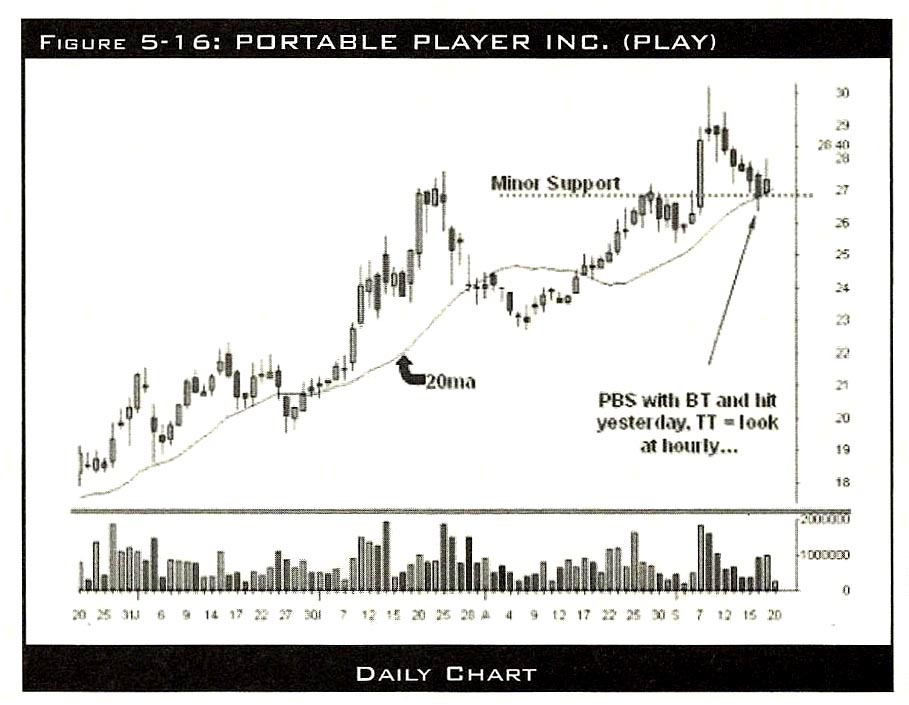
The daily chart above of Portable Player, Inc. was set up as a possible swing trade on the last day shown. It had some positive attributes as a swing. It was at the rising 20 period moving average. It had just broken to new highs on the last rally. Some of you may notice some possible problems. It retraced well over 50% of the last rally. It negated all of a powerful breakout bar. Swing tradable? Well, if you’re not sure, let’s see if we can ‘test’ an entry to see how it plays out. Notice the topping tail that formed on the last bar of this daily chart? Not all topping tails are bad things. When I see a topping tail develop, I want to see how it forms.
Next is the hourly chart for the same time period. Note that here we see that topping tail on the daily, as a nice rally and bullish pullback. The retracement is well under 50% because the real move started the prior day. It sat above the newly rising 20 period moving average. The pullback was controlled.
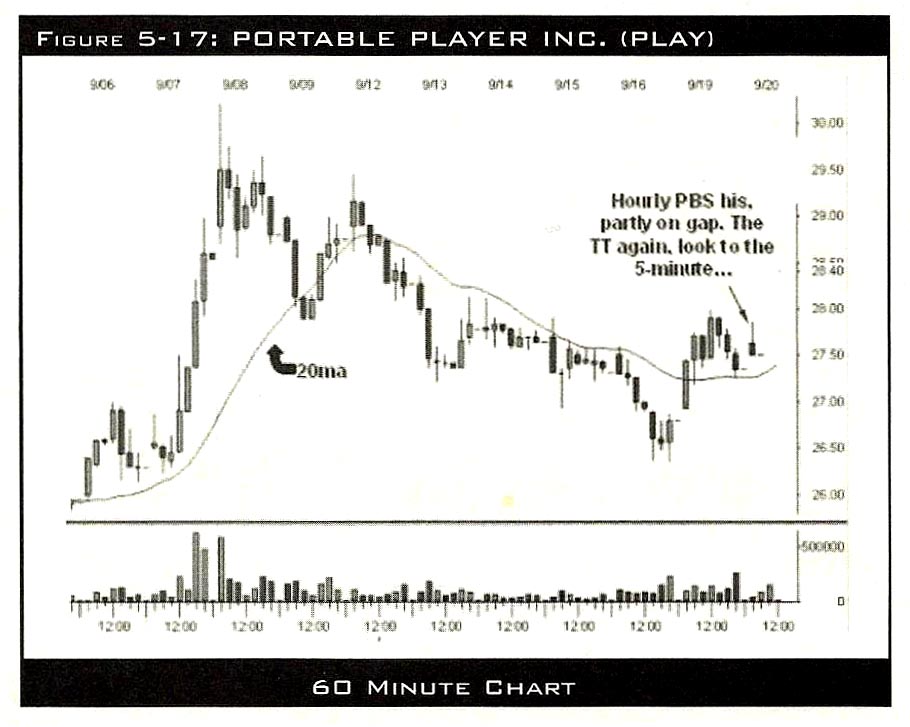
The buy set up that formed hit on the gap up in the morning, but after the gap up, there was a pullback allowing for a 30-minute high type of entry. Note that the stop here is much smaller than using the daily chart. Note also the trade off of using the hourly chart. It is possible that play could trade under the stop on the hourly buy set up (under the low of the low of the second to last bar, around 27.25), but then recover and become a successful trade. The hourly chart player would be out, and the daily chart player would still be in.
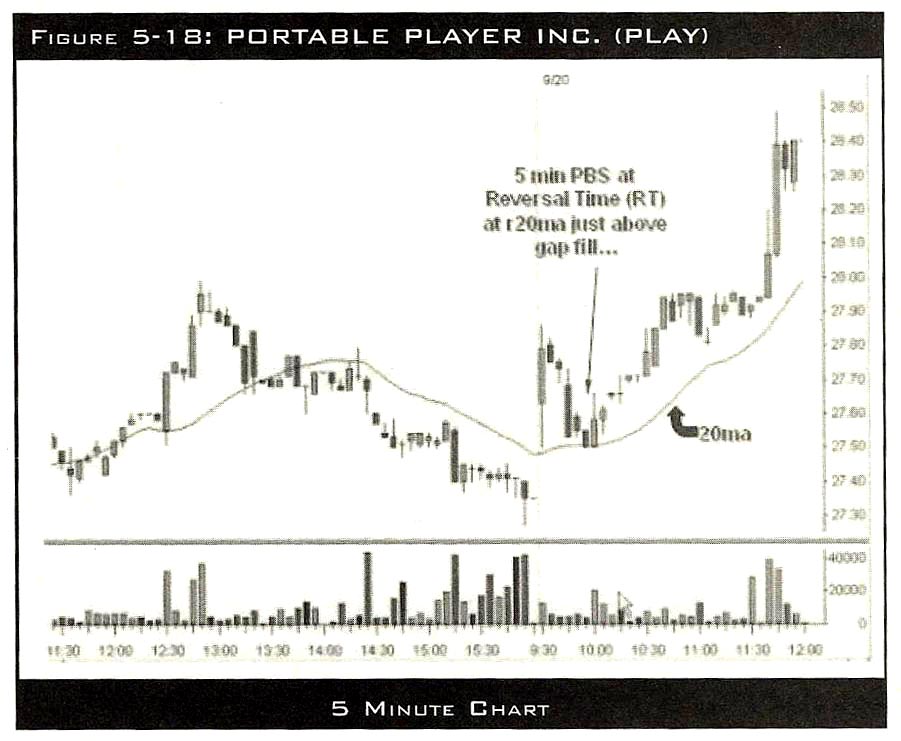
Now, let’s take a look at that morning pullback on the hourly chart below. Look how the pullback looks on the 5-minute chart. You can see how the hourly topping tail formed. A quick move up for one 5-minute bar (a common sight) and then a nice pullback to fill the gap, and a 5-minute buy set up right at 10:00 reversal time. The stop on this play is about $.15 - $.20. Yes, we are looking at playing a nice 5-minute buy set up that is happening on the pullback of a nice hourly buy set up that is happening on the pullback of a nice daily buy set up! Is the application real? Yes, very.
As I mentioned, there are two uses. First, as a scalper, a five-minute buy set up that has the other time frames behind it can help drive the play. You can see the reaction on the 5-minute chart. Second, while zooming down twice may be a bit much for the swing trader, I would be lying if I said this wasn’t done. You can play a large lot size with the tight stop of this play, and sell two lots intraday for profit, keeping the number of shares appropriate for you to hold as a swing. Then, if the swing trade does not work, you are more than likely profitable on the whole trade.