Patterns for Profit
By: Joe Duffy
The following is an excerpt from Joe Duffy's Target Zone Trading
Best Trade Entry Techniques
The patterns we are going to talk about are to be used in conjunction with the philosophy that flows through all of my technical analysis work – that is to look for a confluence of evidence from different techniques and time frames in order to establish a high probability support or resistance area.
There is an important distinction in using these patterns – to establish the probability of support or resistance first, in conjunction with using these patterns to enter a trade. I do not use these patterns in isolation without the other supporting technical evidence.
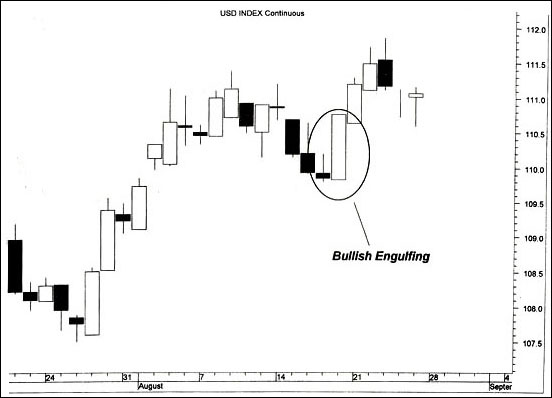
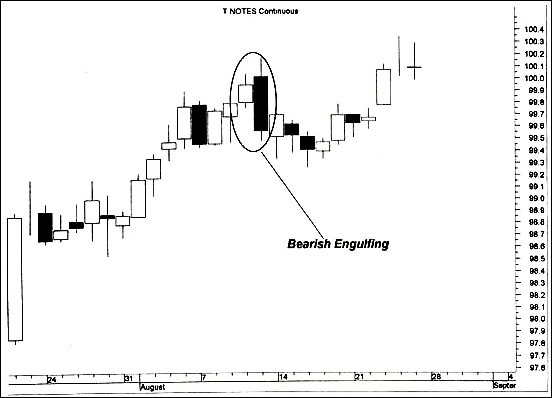
Engulfing Candlestick Pattern
This pattern uses Japanese Candlesticks. A daily candlestick chart represents the open and the close, as well as the high and low for the day. A white candlestick means the close was above the open. A black candlestick means the close was below the open. The body of the candlestick is the difference between the open and the close.
A Bullish Engulfing candlestick is one where the entire WHITE body of the current candlestick engulfs the previous candlesticks body. A Bearish Engulfing Candlestick is one where the entire BLACK body engulfs the previous candlesticks body.
If coming out of a high probability support or resistance zone this is a reliable entry pattern. The only caveat I would make to this is if the engulfing pattern reverses so substantially that it uses up all its energy in that one bar. It’s a bit of a subjective call, and it doesn’t happen that often, but if you see a reversal pattern with a range of 150% or more of the average daily range, you might have cause for pause.
Key Reversal Day
This pattern is particularly important to use in conjunction with support and resistance, as it is prone to false signals otherwise. A bullish Key Reversal occurs when a market makes a new intra day swing low and then closes in the top third of the days range, and closes above the open. A bearish Key Reversal occurs when a market makes a new intra day swing high, and then closes in the bottom third of the days range, and closes below the open. A swing high or low should be defined as making the highest or lowest intra day high or low for the last 4 or 5 (at least) trading days.

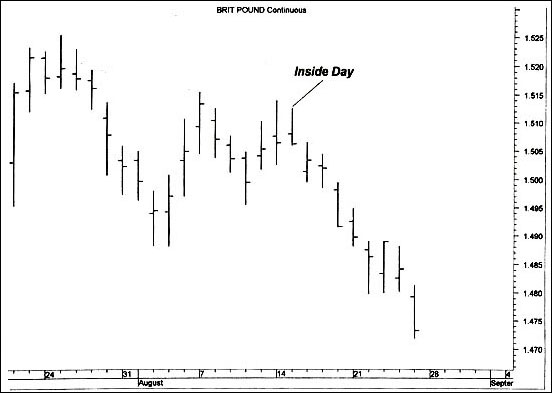
Inside Day
An Inside Day is one in which the entire days range is contained within the range of the previous day. That is the high is equal to or less than the high of the previous day, and the low is equal to or greater than the low of the previous day.
Inside days represent a decrease in market volatility. This decrease in volatility can often be a prelude to a directional move that can be traded profitability. One way to take advantage of this is to follow a breakout of the high or low of the inside day. That is, if one has a preference for the long side, buy on a breakout of the high of the inside day. If one has a preference for the short side, sell on a breakout of the low of the inside day.
In these instances one would use “stop” orders to enter the market. A stop order becomes a market order as soon as a specified price is touched. For example, if one wanted to enter long on a break of the high of an inside day, and the high was say 6880, the order would be “buy 6881 on a stop”. This order would become a market order to buy ONLY if the 6881 price was traded. If 6881 was NOT traded, then the order would NOT be executed.
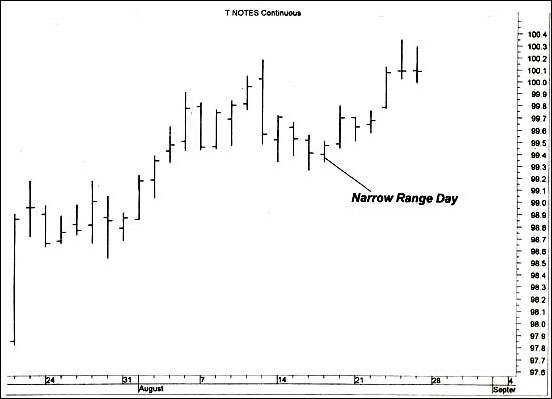
Narrow Range Day
A Narrow Range Day may be defined a couple of ways. The range of a day is defined as the difference between the days high and the days low. The first way to define a Narrow Range Day is that the current day is the narrowest range day over the last “n” days. The “n” period is usually in the 4 to 10 range.
The second way to define a Narrow Range Day is that it is below some percentage threshold of an average of daily ranges. To find an average daily range of, for instance, the last 20 days, add up all of the daily ranges for the last 20 days and divide by 20. Then if the current days range is, for instance, 2/3rds or less of the average daily range, then we have a Narrow Range Day.
Similar to the Inside Day, the Narrow Range Day represents a contraction of volatility that often precedes a trending move. It can be traded in the same manner as the Inside Day, by following a break of the high or low of the Narrow Range Day. I recommend having a directional bias to follow any breakout based on other technical evidence.