
Knowing When to React
By: Oliver Velez
The following is an excerpt from Oliver Velez's Swing Trading Home Study Course
Now this may sound very basic to you, but this very simple concept gives you the ability to perform better than 98% of the so-called-professionals out there. The $64,000 question every single day in the market is how do I know when a decline is an opportunity, or when a decline is a reason for me to run for the hills? Isn’t that the prevailing question? Aren’t entire television shows dedicated to that one answer?
One guy says you should buy because the stock is going higher; another guy says no - the stock is completely shot, there is no more momentum. The two guys are battling on this one question. Is the decline in the stock an opportunity to buy or is it the first sign of trouble?
This concept answers the question. If the stock has made a new high and the decline is falling from a new high, that decline is buyable. It is not a reason to take flight. It is not a reason to get nervous. It is a buyable decline. The same is true in reverse.
With this one simple, basic concept you now have the ability to hold your very own CNBC, buy, hold, or sell session. Imagine taking your first call and John from Wichita says, “My broker says I should buy WXYZ. Do I buy it, sell it, or hold it?” And you could say, “Well sir; I’ve just taken a quick look at the daily chart of WXYZ and I see a very powerful series of higher highs and higher lows. Each time the stock rallies, it is strong enough to take out the peak from the prior rally. Each time it drops, the sellers are incapable of bringing it as low as they did the last time. This is in fact a very strong stock. So your job then, John from Wichita, is to buy on the very next decline.”
Another individual can call up after you’ve been thanked by John and say, “You know what? My broker says that I should be buying ABC.” And you say, “Well ma’am; I have just taken a look at the daily chart of ABC, and the first thing I want you to do is to fire your broker.” That is because this stock is in a severe downtrend. Every single time it rallies, it’s a feeble rally that is incapable of coming anywhere near the prior top and every time the sellers take it down they take it down deeper and further. The stock is being dominated by the sellers. And I suggest that if you happen to have bought already, that on the very next rally you get out. If you haven’t bought, stay away from the stock until that pattern changes.
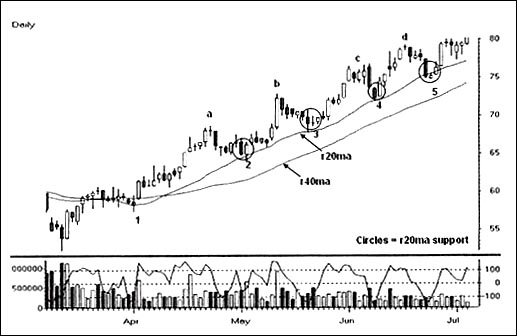
The chart below is the picture of an uptrend. It is the picture of greed leading every rally to higher highs and every pullback finding a higher low. It is smooth, steady, and consistent. The bulls are in control of the entire process.
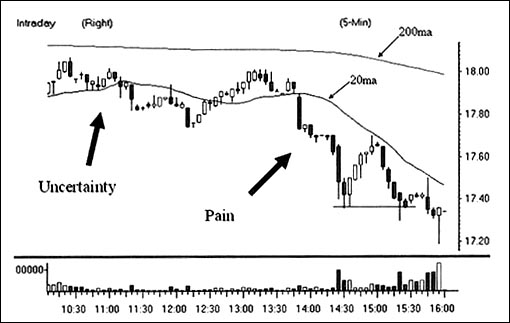
The following chart is the picture of pain. Can you hear them? First, the sideways trend is showing the picture of uncertainty and/or ambivalence. Then the uncertainty becomes fear as prices begin falling, which causes prices to fall faster and pure pain sets in. Soon, more and more will sell until there are no sellers left. Prices will stabilize, but no one will really care where the stock is heading next.
This cycle is the same every time. Extreme fear causes extreme selling until sellers run out. Then a period of ambivalence while everyone ignores the stock, followed by the realization that the sellers are gone, and the stock begins to more up. The buying continues until pure greed takes over. Prices accelerate until no one is certain if the stock can continue any higher, so it stalls during the period of uncertainty. This happens over and over again.