
Risk Reversals
By: Kathy Lien
The following is an excerpt from Kathy Lien's Day Trading the Currency Market
Risk reversals are a useful fundamentals-based tool to add to your mix of indicators for trading. One of the weaknesses of currency trading is the lack of volume data and accurate indicators for gauging sentiment. The only publicly available report on positioning is the “Commitments of Traders” report published by the Commodity Futures Trading Commission, and even that is released with a three-day delay. A useful alternative is to use risk reversals, which are provided on a real-time basis on the Forex Capital Markets (FXCM) plug-in, under Options.
A risk reversal consists of a pair of options for the same currency (a call and a put). Based on put/call parity, far out-of-the-money options (25 delta) with the same expiration and strike price should also have the same implied volatility. However, in reality this not true. Sentiment is embedded in volatilities, which makes risk reversals a good tool to gauge market sentiment. A number strongly in favor of calls over puts indicates that there is more demand for calls than puts. The opposite is also true: a number strongly in favor of puts over calls indicates that there is a premium built in put options as a result of the higher demand. If risk reversals are near zero, this indicates that there is indecision among bulls and bears and that there is no strong bias in the markets.
For easier graphing and tracking purposes, we use positive and negative integers for call and put premiums. Therefore, a positive number indicates that calls are preferred over puts and that the market as a whole is expecting an upward movement in the underlying currency. Likewise, a negative number indicates that puts are preferred over calls and that the market is expecting a downward move in the underlying currency. Used prudently, risk reversals can be a valuable tool in judging market positioning. While the signals generated by a risk reversal system will not be completely accurate, they can specify when the market is bullish or bearish.
Risk reversals become quite important when the values are at extreme levels. We identify extreme levels as one standard deviation plus or minus the average risk reversal. When risk reversals are at these levels, they give off contrarian signals, indicating that a currency pair is overbought or oversold based on sentiment. The indicator is perceived as a contrarian signal because when the entire market is positioned for a rise in a given currency, it makes it that much harder for the currency to rally, and that much easier for it to fall on negative news or events. As a result, a strongly negative number implies oversold conditions, whereas a strongly positive number would imply overbought conditions. Although the buy or sell signals produced by risk reversals are not perfect, they can convey additional information used to make trading decisions.
In the example below, you can visually see that 23-delta risk reversals have been a leading indicator for EUR/USD price action. When risk reversals plunged to -1.39 on September 30, it was a signal that the market had a strong bearish bias. This proved to be a reliable contrarian indicator of what eventually became a 300-pip rebound in the EUR/USD over the course of nine days. When prices spiked once again almost immediately to 0.67 in favor of a continuation of the up move, the EUR/USD proved bulls wrong by engaging in an even deeper sell-off.
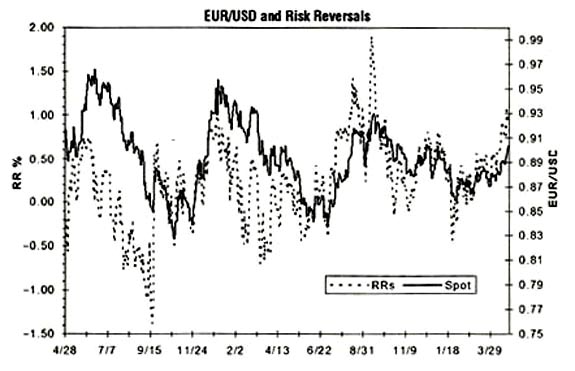
Although there were many instances of risk reversals signaling contra-trend moves on a smaller scale, the next major spike came a year later. On August 16, risk reversals were at 1.43, which meant that bullish sentiment hit a very high level. This preceded a 260-pip drop in the EUR/USD over the course of three weeks. When risk reversals spiked once again a month later to 1.0, we saw another top in the EUR/USD, which later became a much deeper descent.
What Does a Risk Reversal Table Look Like?
Each of the abbreviations for the currency options are listed, and, as indicated, most risk reversals are near zero, which indicates no significant bias. In this example, for USD/JPY the longer-term risk reversals indicate that the market is strongly favoring yen calls (JC) and other dollar puts.
14:40 GMT April 19th |
||||
Currency |
1M R/R |
3M R/R |
6M R/R |
1 YR R/R |
USD/JPY |
0.3/0.6 JC |
0.7/1.0 JC |
1.1/1/3 JC |
1.3/1.6 JC |
EUR/USD |
0.1/0.3 EC |
0.0/0.3 EC |
0.0/0.3 EC |
0.1/0.4 EC |
GBP/USD |
0.0/0.3 SP |
0.0/0.3 SC |
0.0/0.3 SC |
0.0/0.3 SC |
USD/CHF |
0.2/0.2 CC |
0.0/0.4 CC |
0.0/0.4 CC |
0.1/0.5 CC |
JC = Japanese Yen Call
EC = Euro Call
SP = Sterling Put
SC = Sterling Call
CC = Swiss Call