
The Reward to Risk Ratio
By: Oliver Velez
The following is an excerpt from Oliver Velez's Swing Trading Home Study Course
Once you have found a trade that meets the criteria that the strategy requires, what determines if you take the trade? What if there are dozens of these trades that you can find every hour that meet the criteria, but you are able to trade only four, or two, or one? How do you determine the best one?
One of the things you will do is try to find the best examples of quality in the trade you take. Naturally, all trades that meet your minimum criteria are not the same. The reward-to-risk ratio is another important thing you can look at to determine if you take any particular trade. The reward-to-risk ratio, or “RR” is the amount to be made from the entry to the target, compared to the amount to be lost from the entry to the stop.
Many traders will demand that the possible RR for a trade be a certain number, like three-to-one (going for a three dollar target with a one dollar stop), or maybe even much higher. Certainly you would not risk a dollar to make a dollar.
There is a tradeoff in the RR you pick. Very simply, though the high RR trades sound, and often are, the best, they have the lowest odds of being obtained. So, while going for three-to-one sounds better than one-to-one, if you get only the three-to-one trade right one in four times, you are losing money. If you get the one-to-one trade right two out of three times, you are making money. Naturally, the one-to-one trade will be easier to achieve. So you need to analyze every trade based on the RR presented, and the likelihood that you will achieve that RR consistently. You can determine your odds by tracking your results on a trade over a period of time to see how successful you are.
Let’s talk about a sample trade using the daily charts of CRDN and the intraday 5-minute chart of the last day on the daily chart. On the last day on the chart, CRDN gapped up. The play is set up properly, and would call for an entry either immediately over the 5-minute high, with a stop under yesterday’s low. This is the recommended entry and stop. The recommended management sets up certain odds for the play, and may be desirable because it is the best way to manage this trade, or perhaps it is best if it is going to be entered or managed while at work. Sometimes intraday traders find alternative methods of entering and managing the trade.
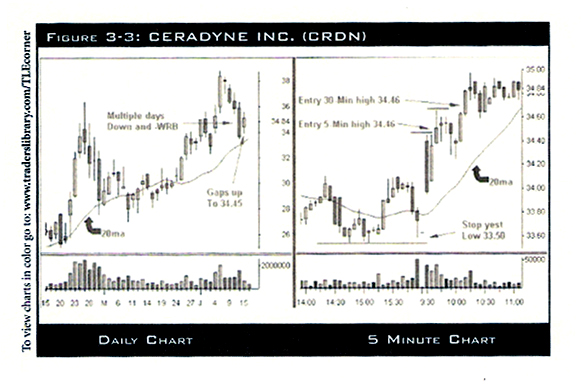
Whenever you stray from recommended strategies, the odds start changing. However, if managed properly, the outcome can be more profitable. Let’s examine the odds of changing the stop from yesterday’s low, to today’s low, with today’s low being 33.95. We will use the 5-minute high for entry.
Take a look at the following tables. In all of these scenarios we will keep the target the same. The goal here is to compare entries and RR options. Notice that for every successful trade, the option using today’s LOD (low of day) stop makes almost twice as much money. This is based on share sizing so that all trades have the same risked dollars. (If you use a constant share size, then the loss would be almost half, so the same concept applies.) What this is saying is that though the odds of this trade stopping out are more likely using the tighter stop, it could stop out almost twice as much and still yield the same amount of money. So, determine if your trades hold the stop at least half as much using the tight stop. If yes, then it is the better option.
Scenario 1: |
|
5 Minute High |
$34.46 |
Stop under yesterday’s low |
$33.50 |
Target (same for all) |
$36.00 |
Risk |
$0.96 |
Reward |
$1.54 |
Risk $$ Sample |
$500.00 |
Profit if Target |
$802.08 |
Scenario 2: |
|
5 Minute High |
$34.46 |
Stop under yesterday’s low |
$33.95 |
Target (same for all) |
$36.00 |
Risk |
$0.51 |
Reward |
$1.54 |
Risk $$ Sample |
$500.00 |
Share Size |
980 |
Loss if Stopped |
$500.00 |
Profit if Target |
$1,509.80 |
Now let’s talk about changing the entry criteria. A trader may say that waiting for the 30-minute high will make the trade at higher odds of success. While this may be true, the RR could change so much at the 30-minute high that it may not make sense.
Let’s say that the 30-minute high is not that far away, so the profit does not change much. It is lower, and the question is, will this entry produce enough success to make up for the lower dollars made every time?
Next let’s look at entering by combining this with another tactic. Let’s buy on the pullback to support at reversal time. In the chart below, CRDN pulled back to support during the very first reversal time, 9:35 EST. This requires a 1-minute chart to be used. The entry is over the high of that lowest 1-minute bar, and a stop could revert back to yesterday’s low, or for the true 1-minute PBS, under the low of the same bar. This reduces risk tremendously.
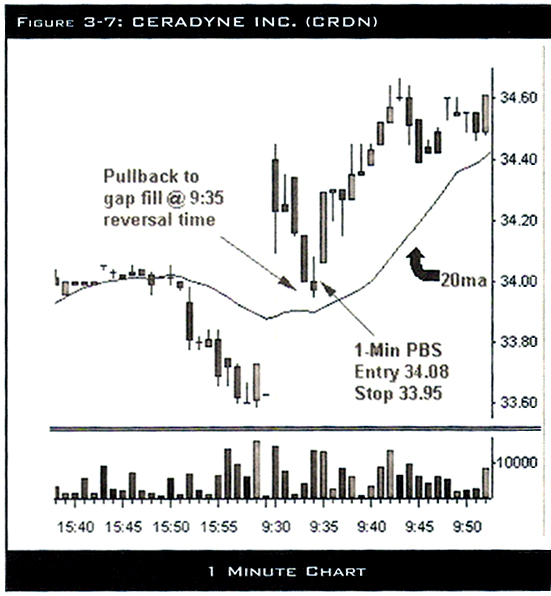
Using the prior day’s low reduces this profit about the same as using the 5-minute high with today’s LOD stop. This is just a coincidence. Taking the 1-minute PBS with that earlier entry keeps the RR the same even though you are now using yesterday’s stop. The drawback is that using this entry is no guarantee that the stock will continue to move up. Many more will stop out.
Last is the ultimate in RR – using the 1-minute entry and stop. This now creates 4 to 12 times the profit when the target is hit. The analysis must now be made: can the target be achieved often enough under these tight entries and stop criteria to produce more dollars on a regular basis? Again, tracking your plays under different options will help you to complete this analysis for any tactic you choose to study.