
Moving Average Crossovers
By: Wendy Kirkland
The following is an excerpt from Wendy Kirkland's Stress Free Wealth Building
Moving averages help to illuminate the current price positions as compared with the recent past. When you advance to creating your own charts, you will be able to choose how large a picture you’d like by selecting the number of calculation periods used in the construction of the moving averages. The determination of how many moving average periods to employ is based primarily on the expected duration of the option. Say you are planning to be in an option for 1 - 6 weeks for example, a 50-day moving average would be useful in determining the current trend.
Price variations and major shifts in trend direction bring about long and short moving average crossovers. Crossovers are a prime indicator of trading opportunities. Trades made in the direction of the shortest moving average crossover as it pierces the longer moving average.
When a long trading signal is recognized, you can consider purchasing a new long (Call) position. When short signals are generated, you would open a new short (Put) position. As shown on the chart below, arrows pointing upward are long signals and you would purchase Calls, expecting the price of the underlying to go up in value. The arrows pointing downward are short signals and you would purchase Puts, expecting the price of the underling to go down in value.
Depending on the underlying equity, crossovers can be a reliable signal. This works well with a chart that clearly shows a trend or that swings up and down in price over the course of a month or more. What you are seeing here is the 9-day Exponential Moving Average (EMA) crossing up or down over the other EMAs. Notice on the chart how the 9-day EMA crosses up through the other EMAs in late October giving us a buy signal, and then crosses down in mid-November, giving a sell signal and/or a signal to purchase a Put.
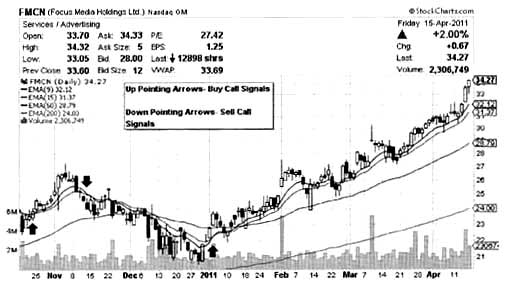
The crossover of the 9-day EMA just after the first of the year produced a wonderful new uptrend that has lasted four months to date.
As a reliable indicator, Moving Average (MA) crossovers work less well in a flat or channeling market. If a stock or index is oscillating in price, but essentially trading within a channel, the crossing moving averages may cause you to be whipsawed in and out of trades. For this reason, the moving average strategy is not universally effective, just as no one technical indicator is effective in all market conditions. The chart below shows an area from December to March where the EMAs were too close to move in and out effectively.
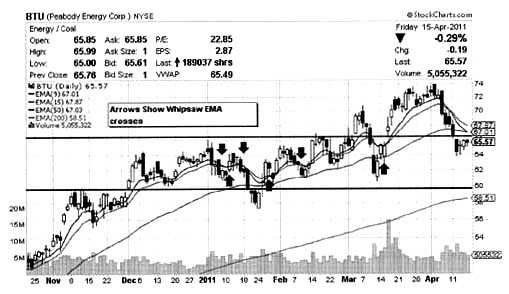
You can see the effect of whipsaw when the short and long signals appear so rapidly that the trade positions haven’t had time to develop and appreciate in value before the direction changed, giving the signal to close the position. Moving average crossovers combined with other determinants confirm when trades should be opened.
Confirmation refers to the use of additional indicators which must be in agreement with or confirm the primary indicator before opening a trade. I recommend choosing about three templates or a series of indicators combined on a chart to use during different trading climates. The crossover technique that we have discussed here works very well a large percentage of the time; looking back at past swings in movement will determine if this is a reliable choice in a particular trading situation.