
Overbought Highs Oversold Lows
By: Duane Davis
Contrary to popular belief, a good day trading system usually does not benefit from the use of profit targets. Notice that we said a “good day trading system”. If you’ve entered a trade more or less on a ‘gut feeling’, it’s wise to incorporate a profit target. However, if your reason for entering a trade is a valid one based on sound, common sense statistics, more profit will be made by staying in the trade until the close of the day session. There are times, however, when psychological support and resistance levels can be used for exiting profitable trades during the day.
There will be times (and they won’t occur that often), when the market will start the day very close to a major psychological support or resistance level. The levels we’re referring to are those that are important to longer-terms traders and investors. An experienced trader can see these price levels on daily, weekly and monthly charts.
In a home study course titled ‘Day Trading 2003’, we teach a ‘common sense’ approach to day trading. The course is designed for students to get both an understanding and an appreciation of a combination of common sense rules that result in what we believe to be low risk day trades. Because our reasons for entering trades are based on sound, common sense tactics, we prefer not to use profit taking rules. However, under certain conditions, profit taking can be considered.
For example, for Monday July 14th, our rules indicated a low risk breakout buy trade at 1001.90 in the regular September S&P 500 futures contract and at 1002.00 in the e-mini (the e-mini trades only in .25 increments). The previous close in the regular S&P was 997.30. Below is a daily chart of the September contract prior to Monday July 14th.
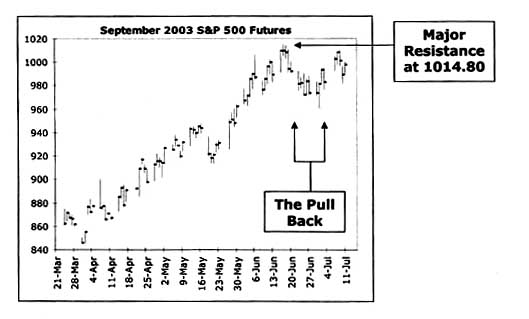
In this chart we can see that the market came a long way from the March lows to the peak in mid-June. The pull back that occurred after the June peak was the type that professional traders often recognize as a possible warning that the next rally may fail at the June 17th high of 1014.80.
Prior to our July 14th trade, the 5-day average trading range in the September S&P contract was just under 12.50. Since the close the previous Friday of 997.30 was within 17.50 points of the major resistance level of 1014.80, we knew that there was a slight chance that the S&P futures could reach the resistance point at some time during our trade and if it did, it would be overextended for the day.
In the early hours of trading on Monday July 14th, prior to the open of the day session, bullish news events took the September S&P to a pre-opening high of 1007.40. Because that price was well above our ‘breakout buy level’ for that particular day we knew that our buy trade would be executed at the open of the day session.
Moments later, the official open for the regular S&P 500 September contract was 1007.50. If we were to assume that 1007.50 was likely to be the lowest price for the day and because the 5-day average trading range was around 12.50, it was very likely at that point that, under normal conditions, the September S&P could trade as high as 1020.00. Notice we said “normal conditions”. At that point, it was obvious that the major resistance level of 1014.80 was well within striking distance.
Had it not been our goal in that particular trading account to trade exactly according to the rules we teach in our home study course, we’d have placed a profit target on the trade somewhere between 1014.20 and 1014.50, just short of the major resistance level. After the market opened, 90 minutes into the day session, the September S&P was knocking at the door of major resistance. As it turned out, the market had become ‘overbought at a recent high’. The high for the day in the regular September contract turned out to be exactly 1014.80. Later in the day, we exited our day trade with a very small loss of just over 1.00 point.