
Trading the 60-Minute Charts
By: Duane Davis
The following is an excerpt from Duane Davis' DIY Success Package
To get an appreciation of what it is to trade using intraday charts, let’s take a look at a couple of examples using 60-Minute charts. The first chart below is of the EUR/USD. Let’s say that it’s 4:00 PM ET, and you decide that you’re going to trade the European Session when it starts 11 hours from now at 3:00 AM. Looking at your 60-minute chart you notice the market is in the process of forming a symmetrical triangle. You also notice that if the market happens to break to the upside and penetrate the upper line of the triangle, the price will probably challenge the recent high just above 1.4950.
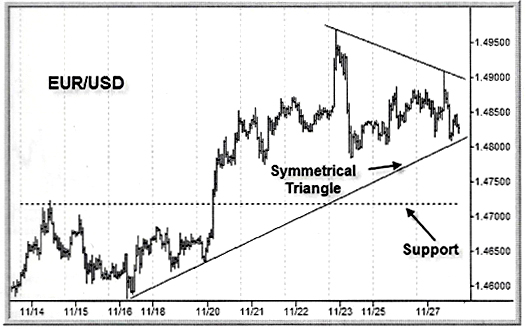
As you continue your analysis and you look at the ‘bearish’ side of the picture, you notice that if the market should break to the downside of the triangle, support should come in at the recent high around 1.4730 (the dotted line on the chart). To make these charts easier to see, we may leave off additional indicators such as Bollinger bands or the RSI. However, in your analysis, it’s always worth applying these indicators to help pinpoint overbought and oversold areas.
Your preliminary analysis is telling you that you’ll be entering two possible orders: One order to buy the EUR/USD on a breakout above 1.4910, and another to sell on a breakout below 1.4800. If the ‘bulls’ win and your buy trade is executed, you’ll take profits in the area of the recent high at 1.4950. However, should the ‘bears’ win and your sell trade is executed, you’ll take profits at the support area around 1.4730.
Before the European Session begins, you decide to take another look at around 2:00 AM ET. Wow – at 2:00 AM it looks as though the bears may win this battle and you may be just in time! You decide to add the RSI to the chart to check for an oversold condition. The RSI is just above the 40 indicating that this market is not yet oversold. You decide to go ahead with your bearish strategy and sell the EUR/USD on a stop at 1.4800. Now you wait to see if your order has been filled, and if it is, you’ll place a limit order to take profits at 1.4730.
As it turns out, the European Session opens and the market goes straight down. Within 35 minutes, the EUR/USD is trading at your ‘target’ price of 1.4730 and your trade is closed out with a profit of 70 pips ($700 for a standard contract and $70 for a mini).
Let’s take a look at another example for the EUR/USD. It’s 5:00 PM ET and you notice that the symmetrical triangle that existed a few days ago is no longer valid now that the market has broken to the down side. However, the top part of that triangle still prevails and you recognize that this downtrend line could provide resistance if the price should get up there.
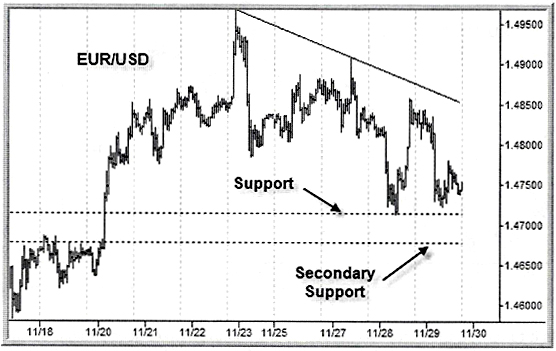
In order to form a new symmetrical triangle, you need a new upward sloping trend line, but there isn’t one. However, the previous horizontal support line around 1.4720 still exists (the upper dotted line on the chart). You also notice that just below the support at 1.4720 is a secondary support area around 1.4680 (the lower dotted line).
You decide that if the market happens to trade up to the declining trend line around 1.4840 that it will probably be too overbought to be able to break through, and that this area might allow you to initiate a short position. But the more likely trade, however, will be a sell off to your secondary support line. Once again, you decide to wait until 2:00 AM to take another look.
At 2:00 AM not much has changed. You notice that the last two pivot lows could be drawn as a very short upward sloping trend line. Short trend lines, however, are not nearly as important as longer ones. So you decide to place an order to sell the upper support line at 1.4720.
Now it’s 9:00 AM and the New York Session is open. At this point, the market looks as though the support area at 1.4720 may be influencing prices to go higher. But, you decide that there’s no reason yet to cancel your sell order.
Finally… it was well worth the wait! The market suddenly reverses and moves aggressively toward the support line at 1.4720 and your trade is executed. You quickly place an order to take profits at your secondary support line at 1.4680. Within a few minutes, your target is hit and your trade is closed out with a 40 pip profit ($400 for a standard contract and $40 for a mini).
We have used simulated trading in these examples to try and help you understand what it’s like to trade using 60-minute charts. If you decide to trade using 60-minute charts, your best bet is to try during either the European Session or the New York Session.