
A Reversal on the Key Reversal
By: Larry Williams
The following is an excerpt from Larry Williams' The Future Millionaires Trading Course
I want to talk about a price pattern that is simply a legend in its own time. It involves a price reversal day. We’ll use the definition that traders have used for the last 50 or 60 years. We will call a ‘reversal day’ any day whose low was lower than the previous day, but whose close is higher than the previous day’s close. This indicates a reversal, since the market went down to new lows for the day, then came back, with buying pressure, closing higher than yesterday’s close. This is a simple key reversal. Depending on which trader you talk with, this is either a phenomenally good, or an astoundingly good buy point.
The records indicate otherwise…
The table below shows the performance of these key reversal days in Standard and Poor’s, Kansas City Value Line, Silver, Treasury Bonds, Pork Bellies, Beans and the Swiss Franc. The study covers 5 years in the nearby month, from 1982 through 1986. The only exceptions are the Stock Indexes, which started trading in 1982, and Silver, where we used 1981 as a start point because 1980 was such an extraordinary year.
Buying a Key Reversal bottom where the key reversal
day is the lowest low of the last 8 days.
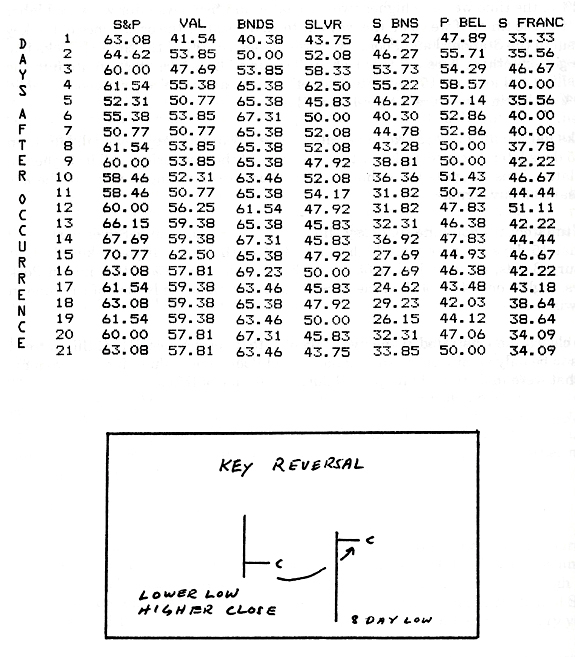
As you read down the column you will see the percentage of times that prices are higher X number of days after the occurrence of the reversal. To make certain that we weren’t getting just any day for the first set of data here, we made certain that the low of the key reversal day was the lowest low of the last eight market sessions. This tells us the market was in fact oversold. Thus, we should have an expectation of a rally.
The numbers are the most impressive for the Standard & Poor’s. Notice that one day after the occurrence of the reversal, we closed higher the next day 63.01% of the time. 64.62% of the time we were higher two days later and five days later we were higher 52.31% of the time. If we go all the way out to 15 days after the occurrence of the key reversal in the Standard & Poor’s, we close higher 70.70% of the time! It looks like we’ve got something here… this looks interesting. Let’s now turn our attention to the Value Line and look out 15 days later as well. Bingo, again we’ve got a good number, 62.50% of the time we were higher 15 days later.
It looks as though we may have a trading strategy here. Wait for a key reversal, buy, then sell 15 days later, because we know that over 60% of the time prices will be higher 15 days later. This suggests to us that perhaps there is something of value to the key reversal as a buy signal.
Unfortunately, it’s not quite that easy. If you turn your attention to Silver next, you’ll see that 15 days later we were higher only 47% of the time. If you take a look at Treasury Bonds, we were higher 65.1% of the time, higher 53% of the time in Pork Bellies, higher only 44% of the time in Soybeans and higher only 46% of the time in the Swiss Franc.
We have clearly demonstrated, using five years of data for each market, that this pattern seems to be only significant to the Standard and Poor’s and Value Line… two markets that were in a strong bull uptrend during the time of this study.
This flat out simply doesn’t work in trading other markets, particularly the currencies. So, the next time your broker or advisor tells you that you must get in a market because there’s been a key reversal, as we have defined it so far, rest assured he does not know what he’s talking about. We have done the painstaking research to see if this pattern is indicative of future market action or not. It simply isn’t. Notice, not only is it not effective 15 days out, it doesn’t seem to be effective even one day out!
It appears that any time we have a reversal we have a high probability that the following day will close down, not up! Notice that not only did we use a simple market pattern here, but we also went to the trouble of making certain the market was oversold… it had made an eight day low… on this basis alone we have high odds that the market should rally, simply because prices have been depressed.
The lesson we learn is that if we do have depressed prices and a key reversal day occurs, as presented here, there’s absolutely no indication to believe (with the exception of Standard & Poor’s and Value Line), that you will be seeing higher prices in the next 15 days. In short, this basic pattern is not profitable for traders.
I am inclined to think that if a pattern is not effective in all markets, the fact it is effective in one market is indicative of random behavior. Accordingly, in my personal trading, the only patterns I’m interested in taking action on are patterns that generally have the same forecasting significance in all markets. Then I know I am dealing with something that is of merit, something that deals with the heart of the problem of forecasting.