
How to Spot 90% Winners
By: Don Fishback
The following is an excerpt from Don Fishback's Options for Beginners
When someone asks me what separates the professional from the novice, one thing comes to mind – the professional try to keep it simple, while the novice tends to make things far more complicated than necessary. The pro, for example, looks for trades that will win consistently, and then implements the appropriate strategy. The key is finding those trades that are likely to be consistent winners. To find them, many professionals use volatility.
Volatility provides you with everything you need to calculate probability. If you want to win consistently, naturally you would look for trades that have high probability of success. I want to show you the simplicity for spotting trades that have a 90% chance of success. This 3-step method is so easy, it will shock you!
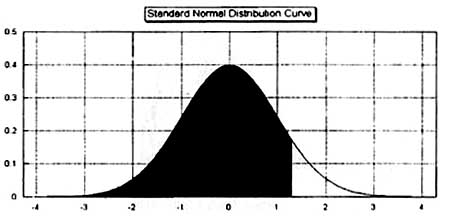
Probability is equal to the area under the bell curve. If we are looking for a trade that has a 90% chance of success, then we need to find a trade whose profit range will comprise 90% of the area under the curve.
Below is a graph that shows you what we mean. The highlighted area identifies 90% of the area under the curve. The 90% boundary is 1.28155 standard deviations. That is, any option strategy whose range of profit is less than 1.28155 standard deviations from the current price is a bearish strategy that has a 90% chance of being profitable. Unfortunately, 1.28155 standard deviations are not useful to a trader. We need to turn it into market information.
This leads us to our first of three steps. The first thing to do is define the 90% boundary in terms of asset prices. Let’s take a look at a generic stock index as an example. Let’s say that the index is currently at 400 and has a volatility of 10%. Remember, we’re looking for the asset price that is 1.28155 standard deviations above our current price, so x = 1.28155. Let’s say we’re looking at a trade that will last 3 weeks (21 days). Let’s plug the numbers into an equation:
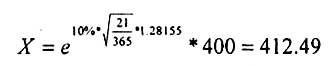
This means that there is a 90% chance that the index will be below 412.49 in 21 days. The graph below illustrates what we mean:
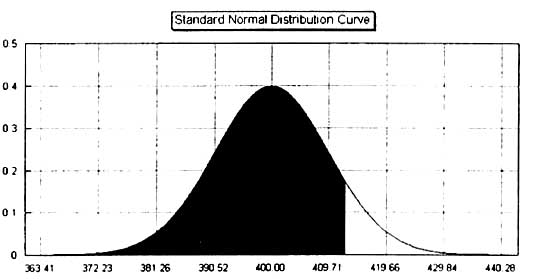
That’s Step 1, converting the probability factor into an asset price, in this case 412.49. The fact that we now know that the index has a 90% chance of finishing below 412.49 leads us to Step 2, which is to select our option strategy. All we need to do now is select a strategy that will be profitable as long as the index remains below 412.49.
The simplest strategy that would accomplish this is to sell a 415 call. Selling a 415 call would, in fact, have an even higher probability of profit than 90%! But it also means that, theoretically, you’d be subject to unlimited risk. A far safer strategy would be to sell a 415 call and simultaneously buy a 420 call (otherwise known as the 415/420 call credit spread). When selling the 415/420 call credit spread, your breakeven is still above 415, so the odds of making money are better than 90% and your risk is limited.
The question that you need to ask here, however, is the reward potential sufficient to offset the risk. Even though that risk is limited it could still be substantial. This leads us to Step 3. If you have a trade that wins 90% of the time, your risk to reward ratio needs to be far more favorable than 9 to 1. For example, if you win 9 times out of 10 (90% of the time), and when you win, you win one and when you lose, you lose 9, your profit after 10 trades will be zero. That’s because 9 times you won 1, for a total of +9, and 1 time you lost 9, for a total of -9. You broke even. That means that for a 90% winner, you need the profit-to-loss ratio to be better than 1 to 9.
In our example, we are looking at a 5 point wide credit spread (415/420 call credit spread). Our risk potential is the difference between the strike prices minus the credit received. Our reward potential is the credit received. We now need to figure out just how big that credit needs to be in order to justify implementing a position. Here is a shortcut that you can use for most credit spreads:
Minimum credit > Difference in strike prices x probability of loss
In our example, the difference in strike prices is 5 points; the probability of profit is some number greater than 90%, so the probability of loss is equal to some number less than 10%. We’ll just use 10% for now. Simply multiply 5 times 10%. That is equal to 0.50. That’s how big our credit needs to be just to break even. Therefore, to earn a profit, we need the credit to be some number bigger than 0.50. The next increment larger is 0.60. That’s it. That’s Step 3.
Let’s review everything. We wanted to implement a limited risk trade with a 90% chance of winning. The trade is: Sell the 415 call and buy the 420 call for a net credit for 0.60 or better. That’s what we’ve got – a 90% winner whose risk and reward potential are properly balanced so that we should make money over the long haul.
This is what I mean by keeping it simple! The professional option trader uses volatility to determine his objective and then finds an option strategy that meets that objective. Above all, they go about this process with the goal of keeping tings as simple as possible. By doing nothing more than following this simple 3-step process, you will automatically put your expected odds of winning at 90%!