Candlesticks: Three Line New Price Break
By: Gary Wagner
The following is an excerpt from Gary Wagner's World's Most Powerful Charting Secret
The "Three New Line Price Break" chart is a variation of the standard candlestick chart and is very similar to the "Point and Figure" chart. The purpose of this chart is to assist in eliminating the potential short term reversal signals that are common on a "Daily Candlestick" chart. This type of chart was developed to be easy to understand and use by generating few signals with a much higher probability of success.
We have found that this style of charting is very effective for stocks or commodities that exhibit an intermediate or long term trend capacity (such as Soybean Oil, Wheat, Oats, Bonds, and some currencies). Most "Blue Chip" stocks or highly liquid commodities (such as SP500, OEX, or Gold) do not produce the best results using this type of charting. By using the candle vision, you are able to test the signals that are generated to determine the effectiveness of this charting technique for individual stocks or commodities.
When using this charting method to trade, there are a few simple rules and phrases that may assist you in making proper trading decisions. These rules and phrases are direct translations from Japanese to English. Most of his information came directly from Seiki Shimizu's book titled "The Japanese Chart or Charts". He goes into great detail to explain how to effectively trade with the Three Line New Price Break chart. The following detailed information will assist you in understanding most of the common terms and trading techniques for using this chart: Three Line New Price Break Trading Rules:
- One should not trade on the first turn (The first line that indicates a reversal in direction), but should wait for the second line.
- If the second line is the same color as the first turning line, then one should buy or sell the market respectively. This technique is very important to understand in order to maximize the effectiveness of entry and exit positions.
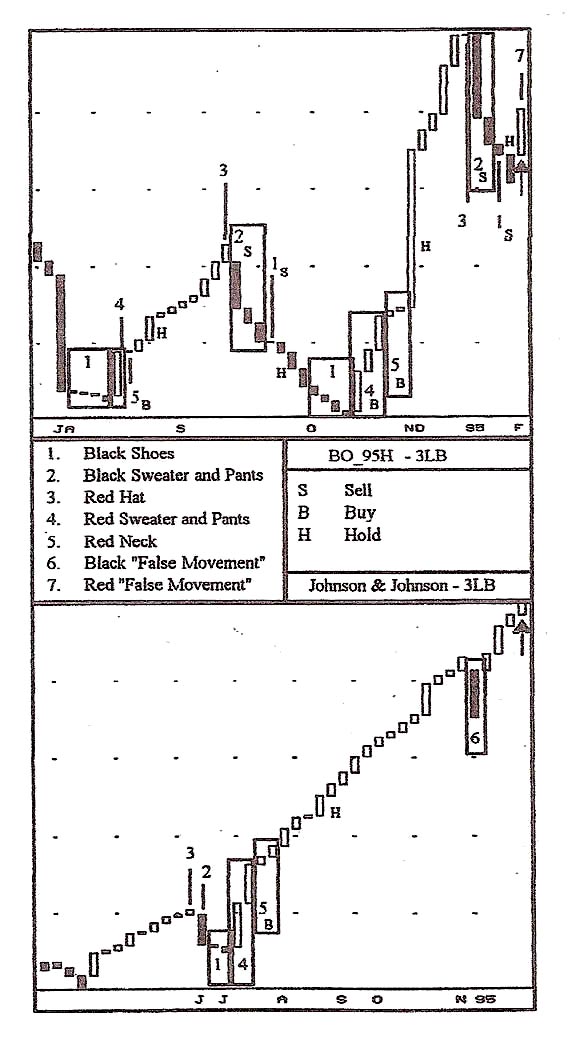
- "Black Shoes" and "Red Necks", after a change in price direction, are an indication that the current price trend is likely to continue. As Mr. Seiki Shimizu discloses, buying or selling the market typically occurs when Black Shoes or Red Necks appear. (Remember Rule #2).
- A red or black "Sweater and Pants" occurs when the turning line breaks above or below the previous four (4) new price lines. The Sweater and Pants formation can also occur when a series of consecutive large range lines appear within a defined trend.
- A "Red Hat" or "Clip Hat" occurs at the ceiling of a market and can be identified by its small size after a sizeable bullish price advance and a black line that follows the Red Hat. The Red Hat is symbolizing the decreased ability of the buyers to advance the current price. This decreasing strength might sometimes warn of possible reversal.
- "False Movement" occurs when a single turning line is drawn and no follow-through of the trend is seen. This lack of follow-through would be indicated by no second or third line of the same color following the first turning line. A recovery of the initial trend normally occurs after a False Movement line.
- One should not rely on just the charts alone, but look at the fundamental and news- related information that may have caused a new line to be drawn.
Two of the most common phrases used with this charting technique:
- If a neck pops out of the Red Sweater and Pants with Black Shoes, the buy.
- If feet come out of the Black Pants while wearing a Black Sweater and a Red Hat ("chip"), then sell.
We suggest using this effective charting technique with a standard Daily or Weekly Candlestick chart.