.jpg "TradeWins Publishing")
Follow
Us:    
|
FOMC Minutes
July 28 - 29, 2015
A meeting of the Federal Open Market Committee was held in the offices of the Board of Governors of the Federal Reserve System in Washington, D.C., on Tuesday, July 28, 2015, at 10:30 a.m. and continued on Wednesday, July 29, 2015, at 9:00 a.m.
Click Here for FOMC Minutes

|
Oliver Velez

OLIVER L. VELEZ has been an active trader for over 2 decades. He is the founder and CEO of Velez Capital Management, LLC, one of the fastest growing private trading firms in the country.
Mr. Velez has personally trained more than 60,000 traders, individual investors, and institutional investors and has traveled the globe extolling the virtues of trading for a living. He is the co-founder and former CEO of Pristine Capital Holdings, Inc. which he grew into a global brand by serving more than 88,000 traders and investors around the world. Barron’s, Forbes, and Stocks & Commodities have all at one time rated his company the #1 educational trading firm.
Oliver L. Velez has been featured as a trading expert on CNBC, CBS, Bloomberg, and FOX News and in publications including the New York Times, Wall Street Journal, Barron’s, Forbes, and Stocks & Commodities, to name just a few. Dow Jones called him “the messiah of trading.” As a Wall Street “insider,” Mr. Velez has personally mentored some of the nation’s biggest and most successful traders.
|
Oliver Velez - former Wall Street insider, best selling author, and internationally recognized trader - announces...
SWING TRADING
The Golden Secret of Price, Time and Market Symmetry
You can know when and where price will turn in every market. Short-term moves and turning points can be pinpointed – absolutely!
Discover the price and time forces which propel and even drive the market each trading day. These forces are nothing less than amazing. There are rhythmical, natural patterns that occur an astounding 80% - 90% of the time in virtually every stock and currency markets’ movements.
(In other words, 80%-90% of the time we know where the market is likely to top and bottom. Precisely. Trading with up to 90% plus win rates – as you’ll see inside – is no accident.)
This secret – the secret to becoming a millionaire – lies within a powerful and shocking new book and DVD.
Learn
More About
Swing Trading
|
|

Better
Business Bureau
|
|
Click
on authors name
to learn more
|
| |
|
|
This week Inside Trading features Oliver Velez who explains how to determine the reward to risk ratio in your trading.
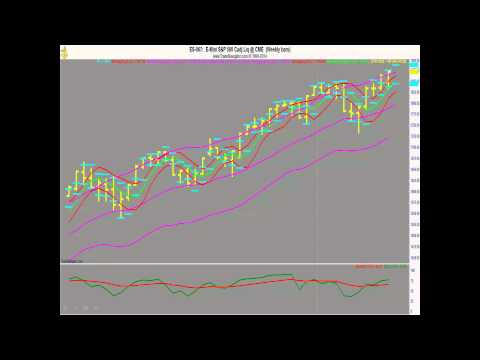
Next, Lee Gettess brings us his weekly video clip covering his bond and S&P market expectations for the coming week.
Then, Jea Yu talks about the preparation needed to trade off the earnings report announcement.
Norman
Hallett wraps up with a video that shows traders a simple technique to help control their emotions.
Enjoy!
Adrienne LaVigne
TradeWins Publishing
 |
|
The Reward to Risk Ratio
by
Oliver Velez
The
following is an excerpt from Oliver Velez's Swing Trading Home Study Course
Once you have found a trade that meets the criteria that the strategy requires, what determines if you take the trade? What if there are dozens of these trades that you can find every hour that meet the criteria, but you are able to trade only four, or two, or one? How do you determine the best one?
One of the things you will do is try to find the best examples of quality in the trade you take. Naturally, all trades that meet your minimum criteria are not the same. The reward-to-risk ratio is another important thing you can look at to determine if you take any particular trade. The reward-to-risk ratio, or “RR” is the amount to be made from the entry to the target, compared to the amount to be lost from the entry to the stop.
Many traders will demand that the possible RR for a trade be a certain number, like three-to-one (going for a three dollar target with a one dollar stop), or maybe even much higher. Certainly you would not risk a dollar to make a dollar.
There is a tradeoff in the RR you pick. Very simply, though the high RR trades sound, and often are, the best, they have the lowest odds of being obtained. So, while going for three-to-one sounds better than one-to-one, if you get only the three-to-one trade right one in four times, you are losing money. If you get the one-to-one trade right two out of three times, you are making money. Naturally, the one-to-one trade will be easier to achieve. So you need to analyze every trade based on the RR presented, and the likelihood that you will achieve that RR consistently. You can determine your odds by tracking your results on a trade over a period of time to see how successful you are.
Let’s talk about a sample trade using the daily charts of CRDN and the intraday 5-minute chart of the last day on the daily chart. As you can see below, on the last day on the chart, CRDN gapped up. The play is set up properly, and would call for an entry either immediately over the 5-minute high, with a stop under yesterday’s low. This is the recommended entry and stop. The recommended management sets up certain odds for the play, and may be desirable because it is the best way to manage this trade, or perhaps it is best if it is going to be entered or managed while at work. Sometimes intraday traders find alternative methods of entering and managing the trade.
The Reward to Risk Ratio
|
Lee
Gettess' Market Sense
by
Lee Gettess
Lee
Gettess is a top trader who is excited
to bring you his video newsletter.
Each week, Lee will share his predictions
on what he anticipates from the bond
and S&P markets.
Watch
Video
|
Earnings Report Trading
by
Jea Yu
The
following is an excerpt from Jea Yu's
Trading Full Circle
Nothing affects a stock price more than its quarterly earnings report. These are pre-planned events. Fortunes can be made and lost in minutes trading these moves.
Recording Galvanized Price Levels
Preparation is the key here. This takes no more than a few minutes. Analyze the daily, weekly and monthly charts and note the following levels:
- Daily 50- and 200-period moving averages
- Weekly 5-, 15-, 50-, and 200-period moving averages
- Weekly upper and lower Bollinger bands
- Monthly 5-, 15-, 50-, and 200-period moving averages
- Monthly upper and lower Bollinger bands
Make specific notes on any of the above levels that overlap within a 0.20 range. The wider the time frame, the more significant the price level. If any price level overlaps 3 or more times (including the sticky 2.50s and sticky 5s), that is a galvanized support or resistance level to which you should pay extra attention. These galvanized levels are where you want to pay the closest attention.
Earnings Report Trading
|
Simple Technique for Controlling Trading Emotions
by
Norman Hallett
Norman talks a little about what he calls ‘letting go of the outcome’ of a trade. At The Disciplined Trader, they are all about managing emotions during a trade, and this week Norman gives a few tips on how to do exactly that.
Watch
Video
|
|