.jpg "TradeWins Publishing")
Follow
Us:    
|
Generating Weekly Cash Income
from Options
Wednesday, December 13th
at 4:30 pm, EST

In this webinar the Hughes Optioneering® Team will explore their GAIN strategy for generating weekly cash income from options.
This simple strategy only takes about 20 minutes a week to implement and you can get started with a $3,500 trading account!
Learn how the Team generated over $9.9 million in actual cash payouts using the GAIN strategy during bull and bear markets.
Click Here to Learn More!

|

During my first decade as a trader and analyst, I was introduced to a strategy that had an extremely high probability of profit. I wanted to understand the mathematical reason for the extraordinary success. It was then that a friend of mine uttered the words that changed my life and ushered in a period of groundbreaking research. My friend Pete said, "It has something to do with that bell curve thing." From that point forward, I have used my mathematical skills to discover unique and profitable trading systems.
It's been more than 20 years since I first entered the financial services business as a broker. I still remember my first speculative trade; it was a futures spread trade involving Live Hogs (all of my friends in the business were farmers). Soon after entering the finance business, I moved away from the brokerage side to the analysis side where I really wanted to be. I must have been doing something right, because I promoted to Director of Research at the nation's largest options-only research boutique. In 1993, I left that firm to start my own company to focus strictly on volatility.
|
|
This 100-page guide is the world's fastest-selling book on options trading - bar none! And no wonder, with its easy-to-read, step-by-step instructions on how to trade options for greater profits with less risk. Options For Beginners takes you step-by-step through the world of options, carefully explaining and illustrating every detail of how you can use options to make money fast at the same time you drastically reduce your risk.
Special Note: All Don Fishback's profits from the sale of this book are donated to the American Heart Association. To date, Don has donated more than $100,000 to help find an end to heart disease.
Learn More About
Options for Beginners
|
|

Better
Business Bureau
|
|
Click on authors name
to learn more
|
| |
|
|
Seasonal trading theories are a dime a dozen.
And while some are ridiculous and unworthy of attention, we have three favorites, including the “New Years Resolution,” “the Holiday Rally,” and the “Dogs of the Dow.”
Next, Lee Gettess provides us with his S&P and bond market predictions for the coming week.
Then, Don Fishback shows us a simple method used to spot winning trades.
Last, Andy Chambers wraps up with his Weekly Market Line in the Sand newsletter.
Enjoy!
Adrienne LaVigne
TradeWins Publishing
 |
|
Our Favorite End of Year Strategies 2017
by
TradeWins Publishing
Seasonal trading theories are a dime a dozen.
- The first half of the year tends to bring better returns than the second half.
- Dow Jones Industrial Average stocks whose price was beaten down in the previous year have a tendency to outperform the rest of the DJIA in the following year.
- There’s even the theory that markets in the northern and southern hemispheres predictably succumb to the winter blues, or Seasonal Affective Disorder.
- There’s the January Effect -- that expected time of year when tax conscious investors sell stocks to write off losses against capital gains. The “tax sell-off” would depress stock values lower until buyers came back in early January.
- There’s the “Sell in May and go away” idea that hasn’t worked so well.
And while some are ridiculous and unworthy of attention, we have three favorites, including the “New Years Resolution,” “the Holiday Rally,” and the “Dogs of the Dow.”
The Dogs of the Dow 2018
With the Dogs of the Dow, you’re simply buying the highest yielding 10 Dow Jones stocks that fell out of favor, investing an equal amount in each, liquidating by January 1 of the following year, and repeating for nearly predictable rewards.
Even better, it's easy to use, and it performs well.
The way you pick the Dogs is very simple.
When the year starts, look at the top 10 yielding dividend stocks in the Industrials. Invest equal amounts of money in all 10 stocks. Then, hold onto those stocks throughout the year. At the end of the year, we do it all over again.
While some, including Barron’s once reported that the “Dogs of Dow Investing Strategy no Longer Works,” that’s not true. Others have noted that research confirmed back in 2007 that the Dogs of the Dow is no longer a successful concept.
Our Favorite End of Year Strategies 2017
|
Lee
Gettess' Market Sense
by Lee Gettess
Lee
Gettess is a top trader who is excited
to bring you his video newsletter.
Each week, Lee will share his predictions
on what he anticipates from the bond
and S&P markets.
Watch
Video
|
How to Spot 90% Winners
by
Don Fishback
The following
is an excerpt from Don Fishback's Options for Beginners
When someone asks me what separates the professional from the novice, one thing comes to mind – the professional try to keep it simple, while the novice tends to make things far more complicated than necessary. The pro, for example, looks for trades that will win consistently, and then implements the appropriate strategy. The key is finding those trades that are likely to be consistent winners. To find them, many professionals use volatility.
Volatility provides you with everything you need to calculate probability. If you want to win consistently, naturally you would look for trades that have high probability of success. I want to show you the simplicity for spotting trades that have a 90% chance of success. This 3-step method is so easy, it will shock you!
Probability is equal to the area under the bell curve. If we are looking for a trade that has a 90% chance of success, then we need to find a trade whose profit range will comprise 90% of the area under the curve.
Below is a graph that shows you what we mean. The highlighted area identifies 90% of the area under the curve. The 90% boundary is 1.28155 standard deviations. That is, any option strategy whose range of profit is less than 1.28155 standard deviations from the current price is a bearish strategy that has a 90% chance of being profitable. Unfortunately, 1.28155 standard deviations are not useful to a trader. We need to turn it into market information.
How to Spot 90% Winners
|
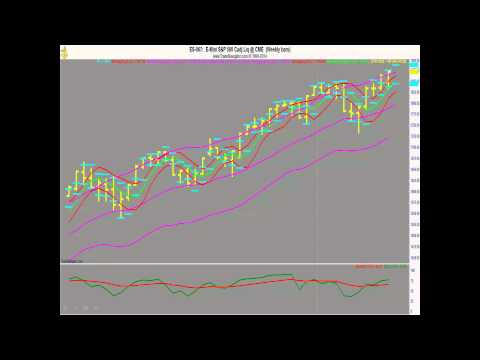
Weekly Market Line in the Sand
by Andy Chambers
The following is an excerpt from Andy Chambers' Weekly Market Line in the Sand
Every week Andy publishes his “Weekly Market Line in the Sand” newsletter. The following are trade updates from his most recent issue.
The trend is up and the bulls have the momentum. Friday’s long tailed bullish reversals point to further advances. A close below Friday’s low in any of the major indices (the Dow, the S&P, the QQQ, IWM, and MDY, among others) would be a sign of a top.
We are long calls in DIA, SPY, QQQ, and IWM. If any of them close below Friday’s low, we want to exit the calls on the open the next day.
S&P E-Mini Futures Weekly: The trend is up. The next targets are 2650 and 2660. A daily close below Friday’s low of 2605 would be a sign of a top.
DIA Weekly: The trend is up. The next target is 250. A daily close below Friday’s low of 239.41 would be a sign of a top.
To Learn More Click Here
|
|