An Outside Look at Inside Days
By: Larry Williams
The following is an excerpt from Larry Williams’ Future Millionaires Trading Course
First, lets define what constitutes an inside day. An inside day is exactly the opposite of an outside day. That is, today’s high is less than yesterday’s high and today’s low is greater than yesterday’s low. Hence the terminology inside day, as all of today’s price range or trading activity took place inside of yesterday’s range.
An inside day is usually thought to be an indication of congestion. A price could not exceed the previous day on the upside nor could it break below the previous day’s low on the downside.
Chartists and authors have not paid very much attention to the inside days over the years. They have made note of them, but this is the first time, to my knowledge, that anyone has made a serious study of the impact of inside days.
And, wouldn’t you just know it…inside days are one of the most reliable forecasting patterns to occur in the marketplace!
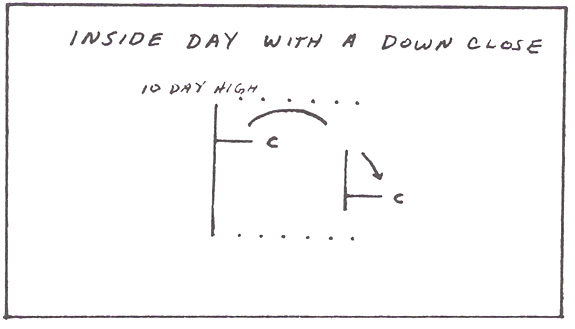
There does seem to be some validity to this. The following chart shows what happens when we have an inside day with a down-close while prices are lower than they were 10 days ago.
In the Standard and Poor’s, 71% of the time you were higher the next day. This may not even be as significant as the fact that 71% of the time you were higher 20 days after this occurrence. In the Value Line, price is higher 50% of the time after the occurrence, and in Treasury Bonds it’s higher 75% of the time.
The pattern in Silver was not nearly as bullish, which surprises me because I had used this trading technique in Silver with some success…which just goes to show you!
In silver, on 36% of the time you were higher 20 days following the occurrence of the pattern. Soybeans were higher 57% of the time, Bellies 50% of the time and the Swiss Franc, where so far we have not found a pattern that forces prices higher, you were up only 22% of the time.
For a moment though, let’s take a look at just the occurrence of an inside day. What happens when we simply have an inside day with a down-close? Does that, on its own merit, forecast any significant market activity? The results are on the next few pages. What can you find?
Then there’s the other side of this coin. What happens if we have an inside day with an up-close? Does this forecast positive action? It appears that it does to some extent. Study the tables for yourself. I have gone to the computer to give you the results for almost all possible configurations of the inside days. While, quite frankly, much of the data suggests random-gibberish-behavior, others are relationships that you can find and successfully trade with.
What you need to focus on here is not that the patterns will always work for you, but that patterns, like methods, systems and tools, will give you the much needed odds that lead to successful speculation.
I have not exhausted all possible ways of looking at inside days with down-closes, though I have looked at the majority of the relationships one can study. There are others. As an example, what happens if the prices are higher, or if prices are lower following an inside day five days later. Does that mean that the down trend will continue? One could also ask the questions about an outside day following an inside day. Is this a particularly bullish pattern? (It is.) As you can see, your opportunity for research here is unlimited. If you have a computer, some data, and a desire to study the markets, here is fertile ground for you to come up with your own great ideas.
Days after occurrence |
S&P |
VAL |
BNDS |
SILVER |
S BNS |
P BEL |
S FRANC |
1 |
47.37 |
50.00 |
37/50 |
55.00 |
75.00 |
50.00 |
56.52 |
2 |
52.63 |
28.57 |
43.75 |
70.00 |
41.67 |
45.45 |
52.17 |
3 |
63.16 |
35.71 |
31.25 |
55.00 |
41.67 |
40.91 |
47.83 |
4 |
52.63 |
50.00 |
43.75 |
55.00 |
58.33 |
40.19 |
52.17 |
5 |
57.89 |
50.00 |
37.50 |
55.00 |
23.00 |
50.00 |
60.87 |
6 |
63.16 |
50.00 |
37.50 |
55.00 |
23.00 |
50.00 |
60.87 |
7 |
68.42 |
50.00 |
43.75 |
55.00 |
25.00 |
59.09 |
47.83 |
8 |
57.89 |
57.14 |
43.75 |
60.00 |
25.00 |
63.64 |
52.17 |
9 |
57.89 |
57.14 |
43.75 |
55.00 |
25.00 |
59.09 |
52.17 |
10 |
57.89 |
50.00 |
43.75 |
60.00 |
41.67 |
68.18 |
60.87 |
11 |
52.63 |
42.86 |
50.00 |
70.00 |
33.33 |
68.18 |
60.87 |
12 |
63.16 |
50.00 |
50.00 |
70.00 |
33.33 |
68.18 |
56.52 |
13 |
57.89 |
50.00 |
37.50 |
75.00 |
30.77 |
59.09 |
52.17 |
14 |
63.16 |
50.00 |
37.50 |
75.00 |
38.46 |
59.09 |
52.17 |
15 |
63.16 |
57.14 |
37.50 |
75.00 |
38.46 |
63.64 |
52.17 |
16 |
63.16 |
50.00 |
37.50 |
75.00 |
38.46 |
59.09 |
56.52 |
17 |
63.16 |
57.14 |
37.50 |
70.00 |
53.85 |
59.09 |
47.83 |
18 |
63.16 |
57.14 |
31.25 |
65.00 |
61.54 |
54.55 |
47.83 |
19 |
68.42 |
57.14 |
23.53 |
75.00 |
69.23 |
59.09 |
43.48 |
20 |
73.68 |
57.14 |
29.41 |
70.00 |
69.23 |
50.00 |
47.83 |
21 |
73.68 |
71.43 |
23.53 |
60.00 |
69.23 |
45.45 |
43.48 |