.jpg "TradeWins Publishing")
Follow
Us:    
|
The SOLUTION
Doesn’t it seem like more than a “coincidence” that the market seems to almost always turn against you after YOU take a trade?
Sometimes you can watch the market trend up and up and up... until YOU get in... and that’s exactly the time the market decides to take a nose dive!
It happens so often that it can’t be a coincidence...
You’re right!
And there is a SOLUTION.
I've personally arranged for renowned trader, author and speaker Dr. Barry Burns to give you (absolutely free) a video tutorial on how and why this happens... and most importantly...
How you can avoid this from happening to you in the future and assure YOU’RE TRADING IN THE DOMINANT DIRECTION OF THE MARKET.
CLICK HERE to get the FREE Video Lesson (no opt-in required).
No opt-in required? Now that’s unheard of these days!
Use this unique "Market Strength Indicator" to help assure the market goes in your direction after you enter a trade.
Simply CLICK HERE NOW
for INSTANT ACCESS!

|
|
Fascinated with the newly invented digital music CD, Steve created his own hardware and software to digitize sound and project the sound waves on his computer screen… creating a computerized digital oscilloscope.
Eventually his work ended up in the hands of the director for a School for the Deaf in Utah… which ultimately led to SpeechMaster, heralded as a breakthrough technology in modern medicine on national TV news and sold to hospitals, clinics and schools worldwide— international companies even bought it for accent reduction.
A group of big-time option traders, who manually calculated market cycles based on the teachings of J. M. Hurst, approached Steve to see if his SpeechMaster code could be converted to analyze market data… and it did. Thus, Market Turning Point was born.
|
"If You’re Like Most People
And You Think the Stock Market’s Unpredictable…
Give Me Just 2 Minutes of Your Time… I’ll Prove You Wrong and Possibly Make You Very Rich!"
Over the past 5 years I’ve called a total of 38 intermediate market bottoms… and an equal number of market tops…
And, if you did nothing more than simply buy the S&P 500 3x ETF every time I announced a market bottom… and then taken profits when I announced the top…
You could have grown a modest $5,000 account into an exciting $741,941.44 fortune… including commissions!
My name’s Steve Swanson. And, I’m about to turn your perception of the financial world upside-down… in a very good and extremely profitable way.
Learn More About
Steve Swanson's
Market Turning Point Trading
|
|

Better
Business Bureau
|
|
Click on authors name
to learn more
|
| |
|
|
The market isn’t cheap anymore. In fact, it’s overvalued when compared with its history, which absolutely poses risk to the upside. While none of us can predict the next crash event, we can help you prepare for it.
Then, Lee Gettess sheds some light on what he expects from the market in his video newsletter Lee Gettess’ Market Sense.
Next, Steve Swanson explains how to interpret economic influences using cyclic data.
Last, Andy Chambers presents his Weekly Market Line in the Sand Newsletter.
Enjoy!
Adrienne LaVigne
TradeWins Publishing
 |
|
The Best Way to Prep for the Next Sell-Off Now
by
TradeWins Publishing
In 1929, stocks were soaring to new highs, just as they are now.
In 1929, stocks were running on the idea of a booming economy, just like now.
In 1929, optimism was explosively higher, just like now.
In 1929, unemployment was low, just like now.
Granted, we can’t tell you with great certainty exactly when the next crash will happen. But what we can tell you is it could catch many of us off guard – AGAIN.
All as markets have become ridiculously overvalued; stretched well beyond fair valuation.
History is Our Guide
In 1929, rampant speculation sent the Dow Jones up 300% between 1923 and 1929. Traders and investors believed stocks could only go up. Speculation forced stocks to unbelievable highs with unjustifiable valuation. Then, it all fell apart.
Between 1929 and 1932, the Dow Jones lost 86% of its value.
In 2000, dot-com optimism sent the Dow Jones to nearly 11,750 until unjustifiable valuations and greed sent it back to a low of 9,731.
In 2008, rampant speculation sent the Dow Jones to a high of 14,038 on the heels of a housing boom. Americans were buying homes they couldn’t afford. Stocks were exploding on economic optimism and unjustifiable valuations, just like in 1929 and 2000.
Even today, stocks are soaring on high levels of optimism and unjustifiable valuation.
That could cost us… especially those that are not prepared.
As I’ll remind you, none of us will be able to time the exact date of the next crash. It’ll catch many of us off guard, just as we’ve seen in previous meltdowns.
Stocks are Clearly in a Bubble
For one, there’s far too much euphoria and the feeling we “can’t lose.”
At 25.63, the S&P 500 price to earnings multiple is the highest it’s been since 2000 and 2008.
Prep for the Next Sell-Off Now
|
Lee
Gettess' Market Sense
by Lee Gettess
Lee
Gettess is a top trader who is excited
to bring you his video newsletter.
Each week, Lee will share his predictions
on what he anticipates from the bond
and S&P markets.
Watch
Video
|
Cyclic Data in the Form of Waves
by Steve Swanson
The following is an excerpt from Steve Swanson's Market Turning Point Trading
Some economic data obviously has greater influence during certain times of the year and the month as well, and may even have a more dramatic impact based on a potential “surprise” factor created by its numbers.
My Market Turning Point (MTP) trading system has advanced analysis that shifts through market data and measures combined economic influences. We use those to help investors understand their combined effect on the market’s movement in upcoming days, weeks, and months.
Let’s consider a graphical representation of how some of those economic reports might influence the markets. Imagine a sine wave that represents quarterly earnings in a very simple way: during the month and a half leading up to that report (issued every 3 months), we would expect a rising wave of anticipation of those results. For now, we won’t consider the actual report results, just the anticipation of the release of that report. After the report is released, its influence gradually declines. Results that were previously speculation become known, actionable facts as anticipation is replaced by hard data. That anticipation/reality cycle repeats for each successive round of quarterly reports.
Here’s a second influence, demonstrated in the chart below, reflecting a one-year period of 220 trading days. The cycle of the Federal Reserve meetings occurs approximately every 60 days. It’s a very important data point because the board of Federal Reserve Governors makes a decision as to whether or not to adjust interest rates.
We know the announcement date for Fed statements varies, but for the purpose of this example we’ll consider those to occur every 60 days. The anticipation effect of their actions will precede the actual announcement.
Also, you can see the times on the chart when both cycles simultaneously peak at precisely the same time, day 80 and day 200. In a bull market, the period leading up to those peak dates may become especially strong, while in bear markets they may become particularly weak.
Cyclic Data in the Form of Waves
|
Weekly Market Line in the Sand
by Andy Chambers
Every week Andy publishes his Weekly Market Line in the Sand Newsletter. The following are trade updates from his most recent issue.
The long term trend is up and the bulls have the momentum. Our bearish bias is gone and we’re switching back with the bulls, primarily due to a new record high in the QQQ and a number of new weekly higher low bottom setups.
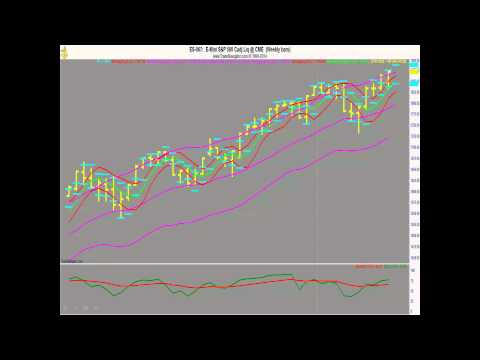
S&P E-Mini Futures Weekly: The trend is up and the bulls have the momentum. The next target is 3200. A weekly close below 2534.00 would put the bullish outlook on hold.
DIA Weekly: The trend is up and the bulls have the momentum. The next target is 285. A weekly close below 233.76 would put the bullish outlook on hold.
On 3/4 we said: We want to Buy to Open the DIA September 21st 2018 240 Put at the market. On 3/5 we were filled at 10.85.
We want to Buy to Open the DIA September 21st 2018 250 Call at the market. The current bid/ask is 13.25/13.75.
To Learn More Click Here
|
|