.jpg "TradeWins Publishing")
Follow
Us:    
|
INSIDER TIPS -
High Performance Indicators
We just partnered with the team at Top Chart Traders to create a new “Insider Tips” eBook called The Best High-Performance Indicators

Inside, you’ll find over 200 pages from 19 traders, including me, Chuck Hughes. We’ll share our favorite indicators, why we use them, how we use them and more!
The entire eBook is FREE...
Click Here
Here’s a tiny sample of what’s included in the eBook:
- Low-Risk, High-Probability Options Strategy
- Using the Stochastic Momentum Indicator
- Trading Smart Money with Volume Spread Analysis
- The “IRB” Trade
- How Candlesticks Can be the Best Indicator
- Key Indicators to Pinpoint Buy and Sell Decisions
And way, way more!
Just Tap Here
Grab your eBook Now!

|
|
Ray trades only those opportunities where the profit potential is HUGE and the risks are small. And with Ray's uncanny approach to market timing you needn't wait long to profit. Occasionally your trades will last 2-3 weeks, but most often you'll double your money in 1-5 days! This keeps your stress, worry and financial risk down to an absolute minimum.
|
Amazing Secret of 59 Money Doublings In 56 Weeks!
Amazing Prodigy Turns $19,500 into $1.03 Million Without Rolling The Dice
Ray Frazier's amazing new book that reveals exactly how he found trades worth $1.03 Million and how you can do it too… without risking one thin dime!
He's made as much as a 753% profit in just three days. And in one stunning exhibition doubled his money nine times in just 13 days!! Meanwhile, with huge monthly profits over 92% of his trading record, his losses are almost negligible. In fact, his worst single contract loss was just $1,087.50… at a time he had already made over $200,000 in profits!
It's Amazing How Simple It Is To Double Your Money!
Huge Profits Now!!
|
|

Better
Business Bureau
|
|
Click on authors name
to learn more
|
| |
|
|
In late June 2017, we mentioned that oil wasn’t a safe bet.
We noted that analysts were calling for $30 oil before long.
We also noted that a good way to trade potential downside in oil was with the Chevron (CVX) August 2105 put, as well as the July 105 put. Technically, we noted, CVX was due for a pullback to about $102 after finding resistance at $108. From here, there are two potential ways to trade oil. In this week's issue, we discuss them both.
Then Wendy Kirkland shares a video about her T3 Trading System.
Next, we bring you Ray Frazier. Also known as the Stock Doc, Ray talks about profit opportunities using bullish chart formations.
Last, Andy Chambers offers his Weekly Market Line in the Sand Newsletter.
Enjoy!
Adrienne LaVigne
TradeWins Publishing
 |
|
What the Oil Bulls Miss are Missing
by
TradeWins Publishing
In late June 2017, we mentioned that oil wasn’t a safe bet.
We noted that analysts were calling for $30 oil before long.
We also noted that a good way to trade potential downside in oil was with the Chevron (CVX) August 2105 put, as well as the July 105 put. Technically, we noted, CVX was due for a pullback to about $102 after finding resistance at $108.
Shortly after saying that, oil ran higher on hope, speculation and short covering.
But our argument for downside remained the same.
With far too much supply, and not enough demand, there’s just not much to get excited about, especially with analysts now calling for oil to drop well under $40 a barrel.
It’s why oil quickly reversed and fell again in recent days.
Oil would fall back under $44 after testing $47.32. CVX now trades at $103 after failing at $106. It’s still likely to fall to $102 in our opinion.
Worse, the EIA would cut its 2017 global fuel demand forecast to 98.39 million barrels a day from 98.46 million. The group even cut its 2018 global fuel demand forecast to 100 million barrels a day from 100.08 million.
Meanwhile, the Saudis seem to have breached the OPEC agreement. In June 2017, they pumped 10.07 million barrels a day, which exceeds its production limit for the first time since the OPEC deal was signed. That’s a boost form 9.88 million barrels a day in May 2017.
Even Goldman Sachs – which noted that “oil prices have likely hit bottom of the price range, and look attractive” – cut its oil target from $55 to $47.50 two weeks after becoming bullish. They also warned that absent a “shock and awe” production cut from OPEC, oil could fall below $40.
What the Oil Bulls Miss are Missing
|
T3 System
by Wendy Kirkland
This video clip from Wendy Kirkland's "T3 System", takes a look at her T3 trading system. Kirkland explains how this pattern is used, and what markets are best traded with the T3. Last, Wendy demonstrates how indicators are used in this system.
Watch
Video
|
Bullish Chart Formations
by
Ray Frazier
The following
is an excerpt from Ray Frazier's Huge Profits Now!!
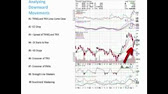
Bullish Flat Base Formation
The flat base formation is the most basic and most common chart formation. It is seen in the charts quite often. Though this formation is considered to be basic, very strong stock price movements to the upside can be gotten from this formation. There is no length of time that is required for this type of formation. The flat base can go horizontally for three days on up and can make huge price movements at anytime after going horizontal.
The key to finding the right flat base is to look at the volume as a stock price goes horizontal. Those flat bases that are more than likely to break the trend line will also have their volume dry up after going horizontal.
When the stock price finally breaks the trend line (resistance), there should be a very big increase in the volume. Otherwise, the move above the trend line could be a false breakout.
The chart below gives two examples of bullish flat base formations. You will note that with the first flat base the stock price hits resistance four times before breaking through. The stock gains ten dollars from the breakthrough price and the top price of the next day.
The second flat base formation only hits resistance twice, but the stock price in between remains in a tight price pattern. From the time the stock price crosses the resistance line the stock gains about fifteen dollars in two days and nearly doubles in value in two weeks.
Bullish Chart Formations
|
Weekly Market Line in the Sand
by Andy Chambers
The following is an excerpt from Andy Chambers' Weekly Market Line in the Sand
Every week Andy publishes his “Weekly Market Line in the Sand” newsletter. The following are trade updates from his most recent issue.
Mini DOW Futures Weekly: The trend is up. The next targets are 22,500 and 25,000. The initial hurdle for the bears is seen at 20,311.
DIA Weekly: The trend is up. The next targets are 220 and 225. The initial hurdle for the bears is seen at 203.64.
SPY Weekly: The trend is up. A further advance is expected. The next targets are 250 and 255. The initial hurdle for the bears is seen at 231.61.
To Learn More Click Here
|
|