.jpg "TradeWins Publishing")
Follow
Us:    
|
Hurry…
Unique Gift Creates Winners!
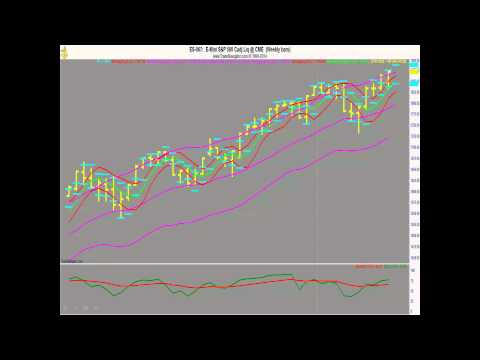
Look at this screenshot and see if you can guess what two oscillators are displayed at the bottom of the chart.
Isn’t it amazing how these two entirely separate indicators... Each measuring a completely different set of conditions...
When stacked one on top of the other create a uniquely powerful ‘hybrid’ indicator... That can predict market turns with nearly 100% accuracy in any timeframe... daily, weekly, hourly... all the way down to 1-minute intraday charts...
Isn't that amazing?
Click Here to Learn More
Stumbling upon this miraculous, one-of-a-kind hybrid indicator saved Wendy Kirkland and her family from financial ruin when a devastating flood left them penniless, with a pile of bills, and no income.
Wendy is sending you this VIP invitation to join her for an exclusive FREE webinar TODAY!
Space is limited, Register Now!
This is her gift to you. I hope you can make it...
Click Here to Register & reserve your seat to learn all about Wendy’s amazing discovery!

|

How did an award-winning artist and sculptor, who owns an eclectic gift shop in Historic Biltmore Village, end up an option guru?
Let’s see...
- The need to take immediate control of her financial future brought Wendy to option trading and the leverage it offers.
- Inspired to help other women enjoy the financial security she had found, Wendy launched WomenOptionTraders.com and began giving online classes.
- A natural-born teacher, her following grew quickly and so did requests for an easy-to-understand book on options. So in 2009 Wendy co-authored, with Virginia McCullough, “Option Trading In Your Spare Time—A Guide to Financial Independence for Women”.
- Then, in 2010 a major uprising… online traders, men and women alike, heard that Wendy’s P3 System produced nearly 100% winning trades and they wanted in.
- When TradeWins Publishing heard about Wendy’s miraculous discovery and tremendous success, they called her right away. The result is Wendy’s new book, which contains the most important parts from her “pink book” and a full-disclosure of her P3 System, in easy-to-follow, step-by-step detail.
|
Imagine The Pure Joy Of Having $20,000 a Month You Don't Have To Work For!

If you've been worried about your financial future TAKE HEART and FEAR NO MORE!
Because, as you're about to see...
Now there's an EASY way for you to detach yourself from the fiscal plight consuming our planet... And seek a dependable income that will forever change your life...
My name's Wendy Kirkland. I'm going to tell you how I discovered the secret to earning a perpetual income that's virtually disaster-proof...
Learn More About
Wendy Kirkland's
Stress Free Wealth Building
|
|

Better
Business Bureau
|
|
Click on authors name
to learn more
|
| |
|
|
It’s quite exciting.
OPEC just noted that it expects to see 266 million EVs on the road in just a few years. The International Energy Agency increased its 2030 forecast from 23 million to 58 million. BHP Billiton thinks we’ll see 140 million of them on the road by 2035.
But for that to happen, the industry needs key materials to make the batteries work, including lithium, cobalt and manganese. All three are in a bind with tight supply and a heavy amount of demand. Does this spell market opportunity? You bet.
Next, Lee Gettess gives us his weekly analysis of the S&P and bond markets.
Then, Wendy Kirkland explains how to spot and profit from moving average crossovers.
Last, Andy Chambers offers his Weekly Market Line in the Sand Newsletter.
Enjoy!
Adrienne LaVigne
TradeWins Publishing
 |
|
The Best Way to Make Money in Q4 2017
by
TradeWins Publishing
Sometimes, making money is easy.
On July 26, 2017, we mentioned taking a position in the DIA, QQQ, and SPY ETFs, as well as the DIA January 2018 220 calls.
Here’s how they’ve done since then.
- DIA ran from $216 to $227
- QQQ ran from $140 to $147.50
- SPY ran from $242 to $254
- The DIA January 2018 220 calls ran from $3.80 to $9.75.
It’s best to exit each of these now to secure wins, especially with the call options.
In early July 2017, we spoke about the HIMX stock at $7.75. It’s now up to $10.82. Sell the stock here to secure the win. We also mentioned opportunity with the HIMX December 2017 9 calls at 80 cents. It now trades at $2.50. We also spoke about the HIMX January 2018 10 calls, which ran from 67 cents to $1.85.
Sell each of those trades as well.
We’re even doing quite well with the cyber security trades we spoke of.
Are we perfect? Do we get it right all the time? Not at all… But we do our very best to help find rewarding opportunities, as those above. Better yet, we’re looking to launch a daily version of this letter as well to bring you even more, bigger opportunities often.
As for new opportunities, sometimes we simply need to uncover supply-demand stories. Right now, one of the biggest stories in the world is the electric vehicle (EV) boom. Many of the cars run on lithium-ion batteries.
The EV Boom Potential
It’s quite exciting.
OPEC just noted that it expects to see 266 million EVs on the road in just a few years. The International Energy Agency increased its 2030 forecast from 23 million to 58 million. BHP Billiton thinks we’ll see 140 million of them on the road by 2035.
Make Money in Q4 2017
|
Lee
Gettess' Market Sense
by Lee Gettess
Lee
Gettess is a top trader who is excited
to bring you his video newsletter.
Each week, Lee will share his predictions
on what he anticipates from the bond
and S&P markets.
Watch
Video
|
Moving Average Crossovers
by
Wendy Kirkland
The following
is an excerpt from Wendy Kirkland's Stress Free Wealth Building
Moving averages help to illuminate the current price positions as compared with the recent past. When you advance to creating your own charts, you will be able to choose how large a picture you’d like by selecting the number of calculation periods used in the construction of the moving averages. The determination of how many moving average periods to employ is based primarily on the expected duration of the option. Say you are planning to be in an option for 1 - 6 weeks for example, a 50-day moving average would be useful in determining the current trend.
Price variations and major shifts in trend direction bring about long and short moving average crossovers. Crossovers are a prime indicator of trading opportunities. Trades made in the direction of the shortest moving average crossover as it pierces the longer moving average.
When a long trading signal is recognized, you can consider purchasing a new long (Call) position. When short signals are generated, you would open a new short (Put) position. As shown on the chart below, arrows pointing upward are long signals and you would purchase Calls, expecting the price of the underlying to go up in value. The arrows pointing downward are short signals and you would purchase Puts, expecting the price of the underling to go down in value.
Depending on the underlying equity, crossovers can be a reliable signal. This works well with a chart that clearly shows a trend or that swings up and down in price over the course of a month or more. What you are seeing here is the 9-day Exponential Moving Average (EMA) crossing up or down over the other EMAs. Notice on the chart how the 9-day EMA crosses up through the other EMAs in late October giving us a buy signal, and then crosses down in mid-November, giving a sell signal and/or a signal to purchase a Put.
The crossover of the 9-day EMA just after the first of the year produced a wonderful new uptrend that has lasted four months to date.
As a reliable indicator, Moving Average (MA) crossovers work less well in a flat or channeling market. If a stock or index is oscillating in price, but essentially trading within a channel, the crossing moving averages may cause you to be whipsawed in and out of trades.
Moving Average Crossovers
|
Weekly Market Line in the Sand
by Andy Chambers
The following is an excerpt from Andy Chambers' Weekly Market Line in the Sand
Every week Andy publishes his “Weekly Market Line in the Sand” newsletter. The following are trade updates from his most recent issue.
S&P E-Mini Futures Weekly: The trend is up and the bulls have the momentum. The next target is 2575. Initial support is seen at 2510. A weekly close below 2485 could result in a further decline. The initial hurdle for the bears is seen at 2414.
DIA Weekly: The trend is up and the bulls have the momentum. The next targets are 230 and 240. Initial support is seen at 224. The initial hurdle for the bears is seen at 215.73.
On 8/13 we said: We want to buy the DIA January 19, 2018 220 Put at the market. 8/14-Bought to Open at 7.55.
To Learn More Click Here
|
|