.jpg "TradeWins Publishing")
Follow
Us:    
|
We Have TWO Exciting Events…
Why do most traders lose money? Because they can... And that’s no joke.
What if there was absolutely no way for you to lose money on your investment?
Sound impossible? Well it’s not!
Actually, creating trades that simply CANNOT lose is surprisingly easy to do. And it’s perfectly legal. But there’s a trick to it. And I think you deserve to know what it is.
That’s why Chuck Hughes is inviting you to join him for a special VIP webinar TODAY, for free...
Win Big & Wipe-Out Losses In 3 Easy Steps [Free Webinar]
If you want to learn a simple trick that literally eliminates all trading risk and super-charges potential profits regardless of market conditions, DO NOT miss this webinar!
Register Here & Reserve Your Seat Now!
Then, next Wednesday, June 21st at 3:30 pm CDT, join Kerry “Dr. Duke” Given for a FREE educational webinar on “Selling Puts Doesn’t Have To Be Dangerous.”
Come listen to Dr. Duke separate the truth from the hype.
Attendees will be entered into a drawing for a FREE giveaway from Dr. Duke!
Register Here

|
|
Jea Yu is a natural born entrepreneur, with several successful businesses to his credit; having started his first business, a medical billing company, before the ink was dry on his University of Maryland diploma. So it’s not surprising that when he became interested in the stock market, in 1998, he immediately founded UndergroundTrader.com.
As it turns out, trading has an addictive allure surpassing any other business you can think of. And Jea quickly became a trusted authority on short-term high profit stock-trading strategies.
|
30 Days from Today Your Money Worries Could Be Over Forever!!!
"The First Time You Earn $50,697 in 30 Days It Feels Like a Miracle… Next Thing You Know, Steady Profits Become A Wonderful Way of Life!"
Before I go on, let me introduce myself. My name is Jea Yu, and when I first started trading it was the “Wild West” compared with today. The year was 1997, “dot-com’s” were creating new millionaires every day, and I was determined to become one of them!
In 1998 I founded UndergroundTrader.com. Since then, I’ve just about done it all. And I can tell you with absolute authority that the market is a much different place today than it was a decade ago.
The good news is… I have perfected a way to do exactly that!
The unique UndergroundTrader System essentially foreshadows the market and makes an upcoming price move apparent minutes, hours, maybe even a full day before it gets underway. And with insight like that, winning is easy!
Learn More About My
UndergroundTrader System
Trading Full Circle
|
|

Better
Business Bureau
|
|
Click
on authors name
to learn more
|
| |
|
|
So how do we spot opportunities? One of the best ways is to simply watch momentum indicators, which gauge the sentiment of fearful and greedy traders. For example, for the last 20 years, I’ve used Bollinger Bands, moving average convergence divergence (MACD), relative strength (RSI), Williams’ %R (W%R) and a host of other indicators. In my article this week, I will explain how you can use can these indicators too.
Next, Lee Gettess looks at stocks and bonds for the coming week.
Then, Jea Yu explains how Fibonacci retracements and extensions are used to identify price swings.
Last, Wendy Kirkland offers her Prime Entry Profits (PEP) Rally Newsletter.
Enjoy!
Adrienne LaVigne
TradeWins Publishing
 |
|
How to Win 80% of the Time
by
TradeWins Publishing
Trading Secrets: How to Win 80% of the Time
Always trade excessive fear and greed.
It’s how Warren Buffett has made so much money. In fact, to this day, he’ll tell you to “be fearful when others are greedy; and greedy when others are fearful.”
Baron Rothschild would tell you to “buy when there’s blood in streets.”
Sir John Templeton would tell you to buy at “points of maximum pessimism.”
They all took full advantage of herd mentality. They know as well as we do that excessive fear can lead to value. They also knew the excessive greed could lead to rewards, as well.
So how do we spot such opportunities?
One of the best ways is to simply watch momentum indicators, which gauge the sentiment of fearful and greedy traders. For example, for the last 20 years, I’ve used Bollinger Bands, moving average convergence divergence (MACD), relative strength (RSI), Williams’ %R (W%R) and a host of other indicators that we’ll discuss moving forward.
To make money using these indicators, each has to be in agreement with the others.
Look below at a chart for NVDA, for example. At $95 a share in early March 2017, the stock found double bottom support following a laughable downgrade that sent the stock too low, too fast. At the same time, though, RSI was at its 30-line. Money Flow was nearing its 20-line. Williams’ %R was under its 80-line. All confirmed the stock was oversold at support.
At $95 a share in early March 2017, the stock found double bottom support following a laughable downgrade that sent the stock too low, too fast.
S/L: How to Win 80% of the Time
What do you think of the new chart/trade of the week feature? Let us know: Click Here.
|
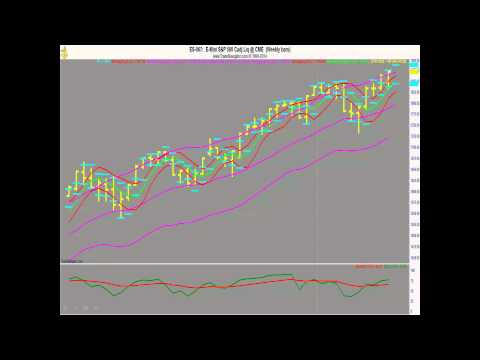
Lee
Gettess' Market Sense
by Lee Gettess
Lee
Gettess is a top trader who is excited
to bring you his video newsletter.
Each week, Lee will share his predictions
on what he anticipates from the bond
and S&P markets.
Watch
Video
|
Fibonacci Retracements and Extensions
by Jea Yu
The following
is an excerpt from Jea Yu's Trading Full Circle
Most technical analysts extensively use some sort of ratio analysis for potential entry and exit strategies. The application of Fibonacci numbers to this ratio analysis lead to terms like Fibonacci retracement, or Fibonacci extensions, etc. Financial markets exhibit pullbacks and extensions with enough frequency that Fibonacci retracements to ratios like 38.2%, 50%, or 61.8% have become common jargon in a trader’s language.
The backbone behind Fibonacci studies is made up of the price retracements and extensions. The study of these retracements and projections enables traders to identify price swings and support & resistance areas.
Markets demonstrate repetitive patterns where prices oscillate between one set of price ratios to another, making price projections possible. Market trends can be defined by geometric relationships as they exhibit harmonic relationships between the price and time swings. Markets also form cycles around the price and time levels. Many investors and traders use cycles and harmonic relationships to project future price swings and times.
Each price swing consists of high and low prices and many bars in between them, followed by a reversal swing consisting of the same high and low prices, but in the opposite direction. If the prior swing is an up swing, then the following down swing is a reversal swing, or retracement. A high swing occurs when the current high bar has a lower-high bar before and after. A low swing occurs when the current low bar has a lower-low bar before and after.
Fibonacci retracements and extensions, as illustrated below, offer key support and resistance areas. Here are some definitions of retracements and extensions:
- Retracements: Retracement is defined as when a price re-traces a portion of the prior swing. This portion could be defined in Fibonacci ratios like 0.38, 0.5, or 0.618.
- Extensions: Extensions occur when the price expands the entire prior swing (100%) and travels beyond the entire swing. The extension swing could be 127% or 162% of prior swings.
- Projections: Projections are defined as when price extends away from a completed retracement swing in the same length (or more) as the first swing.
Fibonacci Retracements & Extensions
|
Prime Entry Profits (PEP)
by Wendy Kirkland
The following is an excerpt from Wendy Kirkland’s Prime Entry Profits
Every day Wendy shares her “Prime Entry Profits” (PEP) Rally Newsletter. The following is her thought for the week, along with what she expects this week in trading.
Thought for the Week: Demonstrate a positive attitude as you strive for great things. Seek a supportive environment that amplifies your motivation.
This Week in Trading: Indices opened with decent gains and made small moves up throughout the day yesterday.
Earnings are still going on so please remember to check earnings dates on your trade candidates.
EXPE- Expedia - P3 SS
CVX- Cheveron - P3.5
QCOM- Qualcomm - P3.5
DE- Deere & Co - P3
AAL- American Airlines - P3
To Learn More Click Here
|
|