.jpg "TradeWins Publishing")
Follow
Us:    
|
Yours Today:
Life-Changing Discovery
Do you think you could spot this squeeze pattern on a stock chart?
Because if you can, your money worries are over forever!
Isn’t it amazing how these two entirely separate indicators... each measuring a completely different set of conditions... when stacked one on top of the other form a 95% accurate ‘hybrid’ indicator?
Learn all about this
amazing discovery...
Go Here to Register
& Reserve Your Seat
In this training I’ll teach you step-by-step how to construct and profit from this phenomenal hybrid indicator... using charts readily available for free on the internet.
Without ever buying a single thing!
Space is limited. So please... Reserve Your Spot Now while you can!
Register Here

|
|
Chuck Hughes, who started his trading in 1984, was a full-time commercial airline pilot. However, according to Hughes, his job as pilot was quite frustrating sometimes. This is the reason that he wanted to start his own trading. His working schedule of 15 to 17 days off each month used to create a void and trading was the perfect solution for this. Hughes got quick success in trading as he finished 10th in the '85 United States Trading Championship and 3rd in '86 competition with a huge 260% return.
Chuck Hughes also accrued titles in the systems trading in another international trading championship in futures in '94 and '95, the day trading division of '95, and the professional division in '99. In 2003, Chuck Hughes was placed third in the in the same competition for Stock Trading. Then in 2005, 2007 and 2009 he took first once again in the stock trading division.
|
Over $1,090 Profits Per Minute!
($10,905 in 10 Minutes!)
That’s five minutes to enter the trade, five minutes to exit. Ten total minutes to complete the Costco trade that will earn a minimum of 1,090.5% — maybe more.
Best of all, this was NOT a one-time event. That same week, it happened again. This time our little group had the opportunity to make $28,546.00 — a staggering $2,854 per minute!
To put this into perspective…
Had you been among this small group of ordinary individuals, and assuming you invested just $5,000 on each of these three dates… following my exact instructions… You would’ve pocketed a grand total of $170,750 in just 30 days!
Learn More About
Chuck Hughes'
Lifetime Income System
|
|

Better
Business Bureau
|
|
Click on authors name
to learn more
|
| |
|
|
“Opportunity is missed by most people because it is dressed in overalls and looks like work.”
Those very words of Thomas Edison still hold true today.
But rest assured, that’s a mistake – a potentially costly one that’s cost investors millions, especially when they overlook game-changing opportunities.
In fact, those are the very opportunities we attempt to find for this weekly letter.
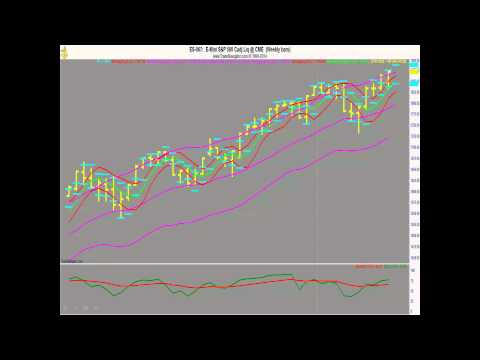
Next, Lee Gettess sheds some light on what he expects from the market in his video newsletter Lee Gettess’ Market Sense.
Then Chuck Hughes provides an article explaining how to trade successfully with trend following.
Last, Wendy Kirkland covers her Prime Entry Profits (PEP) Rally Newsletter.
Enjoy!
Adrienne LaVigne
TradeWins Publishing
 |
|
The Key to Uncovering Game Changing Opportunity
by
TradeWins Publishing
“Opportunity is missed by most people because it is dressed in overalls and looks like work.”
Those very words of Thomas Edison still hold true today.
But rest assured, that’s a mistake – a potentially costly one that’s cost investors millions, especially when they overlook game-changing opportunities.
In fact, those are the very opportunities we attempt to find for this weekly letter.
For example, on July 27, 2017, we uncovered multiple opportunities following an Amazon-induced gap down. We mentioned the following trades, most of which exploded higher.
- The Home Depot (HD) September 145 calls have run from $4.40 to $7.50
- The Lowe’s (LOW) September 77.50 calls have run from $2.30 to $2.90 so far
The week prior, we talked about taking positions in the following:
- SPDR Dow Jones Industrial (DIA), which ran from $217 to $220
- Power Shares QQQ (QQQ), which is currently flat
- SPDR S&P 500 ETF (SPY), which is also currently flat
On July 12, 2017, we talked about buying unloved stocks, like AT&T (T) and Verizon (VZ). To date, T has run from about $36.60 to a high of $39.67. VZ ran from $43 to a high of $49.50.
And all we had to do was buy these stocks when others weren’t looking.
While we didn’t do so well so far with our trade on CVX, given the latest run in oil, we can clearly see there are plenty of great trading opportunities.
Game Changing Opportunity
|
Lee
Gettess' Market Sense
by Lee Gettess
Lee
Gettess is a top trader who is excited
to bring you his video newsletter.
Each week, Lee will share his predictions
on what he anticipates from the bond
and S&P markets.
Watch
Video
|
Let Price Movement Determine When You Buy or Sell
by
Chuck Hughes
The following
is an excerpt from Chuck Hughes' Lifetime Income System
Through experience I have learned that you want to purchase a stock only if the buying pressure exceeds selling pressure as indicated by the stock being in an up trend. Buying a stock in a down trend is risky as it requires you to correctly predict when the stock will ‘bottom out’ and resume a price up trend.
Buying a stock because it is cheap and predicting that the price has bottomed out can be nearly impossible to forecast correctly on a regular basis. This ‘crystal ball’ type of approach is risky as you must correctly predict the future price movement. A safer approach would be to wait until a stock is in price up trend before buying. A stock’s price reflects all of the known information about a company so let the price movement of the stock tell you when you should buy and sell.
Similarly, you don’t want to take a short position in a stock unless the stock is in a price down trend. Taking a short position in a stock in a price up trend requires you to correctly predict when a stock will top out and start a price down trend.
Quantitatively Measuring Buying and Selling Pressure
There are many variations of moving averages that can be used to determine the price trend. In my experience, the 1-Month Price of a stock in relation to its 10-Month Simple Moving Average (SMA) is an excellent way to quantitatively identify the price trend of a stock. Identifying the price trend allows us to know in advance the most likely future price movement of a stock.
Price Movement
|
Prime Entry Profits (PEP)
by Wendy Kirkland
The following is an excerpt from Wendy Kirkland's Prime Entry Profits
Every day Wendy shares her “Prime Entry Profits” (PEP) Rally Newsletter. The following is her thought for the week, along with what she expects this week in trading.
Thought for the Week: Allow (without the slightest doubt) the Law of Attraction to bring you what you want. If you have any doubt that what you want will manifest, this will delay the Law of Attraction from bringing it to you.
In Trading: The indices made some gains until around noon when the markets turned downward. The DOW closed at -33, Nasdaq -13, S&P -5.
Earnings are still going on so please remember to check earnings dates on your trade candidates.
GDX - Gold Miners ETF- P3
X - US Steel- P3.5
TLT - Bond ETF- P3
TSLA - Tesla- P3.5
FB - Facebook- P3.5
To Learn More Click Here
|
|