5 Days, 36 Professionals, 36 Hours of Tips and Strategies for Active Traders
You're invited to join us at the Online Traders Conference on May 16-20, 2022, sponsored by MetaStock and Technical Analysis of Stocks and Commodities.
Thirty six industry experts are going to show you what it takes to be a successful trader in ANY market with ANY account size. This event is for traders of all levels, and all presentations will be recorded and delivered to everyone that registers.
With five days of learning and full access to the recordings just for registering you can’t afford to miss this amazing event. We’ve worked hard to bring the best presenters to give you the best actionable trading ideas at this conference.Learn more about the presenters and get more details about their presentations.
Bonus: Door Prizes! All registrants will be eligible to win random drawings for valuable prizes. We will have multiple drawings each day. Don't miss it.*
Tomorrow, you could begin doubling your account every single month starting with one letter.
The letter will come from a 20-year trading professional named Ian Cooper. He says, “In 2022, following my trades you would be doubling even tripling your account some months. Let me show you how.”
He will show you exactly what to do... and he’ll give you the blueprint for just $1.
I’m a diehard technical analyst, but I know that “technicals” do not move the market. Traders may use various technicals to describe or measure or predict price movement in a market, but these technicals are not the underlying root cause for changes in price. The root cause – is just good plain old-fashioned supply and demand. And supply and demand is the basic factor underlying the fundamental approach.
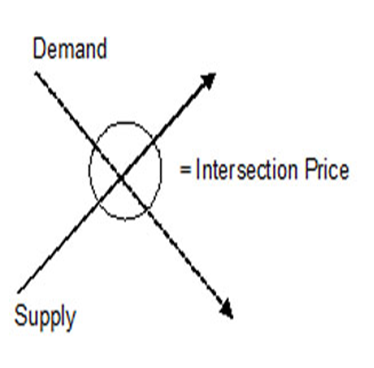
A little review of basic economics will explain the dynamics of price changes. Look at the supply/demand diagram provided below. The supply curve is the arrow that is sloping up and to the right, while the demand curve is the arrow that is sloping down and to the left. The point where they intersect is the fair market price where both buyers and sellers are willing to agree on value. All you have to remember for now is that when either the supply line or the demand line moves, the intersection point, and therefore the price, will change.
It is increases or decreases in supply or demand that actually causes the price to move. And when the market price moves, and keeps moving in a certain direction, the result is what we call a trend. If prices continue to rise, we call it uptrend. If prices continue to fall, we call it a downtrend. Trends tend to proliferate more in commodity markets than in equity markets. As a result, trend-following methods tend to work better in commodities and futures than in equities (stocks), although they do sometimes work pretty well in equities too.
Let’s walk through some examples of how markets can change, first from a fundamental perspective, then from a psychological perspective, and finally, from a technical perspective. To begin, let’s look at a few basic laws of supply-and-demand economics:
If demand increases while supply stays constant, prices will rise.
If demand decreases while supply stay constant, prices will fall.
If supply increases while demand stays constant, prices will fall.
If supply decreases while demand stays constant, prices will rise.
We’ll start with a physical commodity example, but keep in mind that these same scenarios can also be extended to other physical products, to all financial products such as bonds or currencies and, to a slightly lesser extent, to stocks and even stock indexes.
Let’s begin with coffee. Brazil and other agricultural countries keep growing the crop at a rather steady rate, and most of the rest of the world keeps drinking the stuff on a pretty regular basis as well. Assume that most economic conditions are in equilibrium – that is, the amount of land available to grow crops is all in use, and the technology for producing and harvesting is mature and not undergoing any improvements. Therefore, the supply should be pretty steady and constant, all other things being equal. What will happen to the price as demand changes?
Constant Supply, Increased Demand
What do you think would happen if all of the sudden, research scientists discovered that drinking five cups of coffee a day would greatly reduce the chances of ever getting a heart attack? You can imagine that the demand for coffee, and thus the price of it would go through the roof.
Constant Supply, Decreased Demand
Now look at the other side of the coin. Suppose that after years of research, scientists one day discover that drinking too much coffee increases the chance of getting a heart attack. People are likely to get scared to drink coffee, demand will decrease, and the price of coffee will plunge.
Constant Demand, Decreases Supply
One day a big cold weather front hits the major coffee growing regions in South America, destroying half of the current crop. Now most of us still need our morning coffee to start the day – that is, the demand remains pretty constant or in economists’ terms, inelastic. With the supply reduced all of a sudden, coffee prices are going to go through the roof.
Constant Demand, Increased Supply
Finally, in the last of our four possible market scenarios, demand remains constant but the overall supply increases, perhaps due to some technological innovation that improves harvesting efficiency. The extra supply is more than the market can handle. Coffee merchants are desperate to sell their stores. Prices are sent into a sharp downward trend.
To summarize, as long as supply and demand are reasonably constant and market economics are in equilibrium, the price of any item will remain in a relatively narrow trading range. But once either the supply or the demand (or both) fundamentally changes, even if it is a temporary and not a permanent condition, the price will move out of its old trading range, and the market will seek to find a new level of equilibrium.
This move to a new level can happen quickly or gradually, but most markets tend to move in a building trend as more and more traders recognize the changes in conditions, rather than a move happening in one quantum jump. It is precisely this gradual movement, going through a range of prices, that we call a “trend”.
Four Scenarios, All Markets
If you were to examine the reasons behind large fundamental shifts (permanent or temporary) in supply and demand curves – and, thus, ultimately in market equilibrium – you would find that the answer is usually some large and important event. Different kinds of weather patterns, such as floods or droughts or freezes, can most certainly wreak havoc with the supply side of physical commodity crops such as coffee or soybeans or orange juice. Alternatively, a new scientific health or medical discovery may cause major shifts in the demand side of the equation.
But it’s not just the physical crops, or old-style “commodities” that are subject to these scenarios. They can be extended to all other tradable entities. For example, major political events, such as a war, election, assassination, etc., will undoubtedly have an effect on financial markets such as currencies and interest rates as supply, demand, or both are affected in these markets.
For traders to profit, trending markets are necessary. And as long as we don’t’ have perfect control over the environment and all aspects of our lives, as long as mortal humans are subject to the shims of Mother Nature or political action somewhere in the world, economic shifts will continue to take place and markets will trend. It’s fundamental.
PLEASE READ: Auto-trading, or any broker or advisor-directed type of trading, is not supported or endorsed by TradeWins. For additional information on auto-trading, you may visit the SEC’s website: All About Auto-Trading, TradeWins does not recommend or refer subscribers to broker-dealers. You should perform your own due diligence with respect to satisfactory broker-dealers and whether to open a brokerage account. You should always consult with your own professional advisers regarding equities and options on equities trading.
1) The information provided by the newsletters, trading, training and educational products related to various markets (collectively referred to as the “Services”) is not customized or personalized to any particular risk profile or tolerance. Nor is the information published by TradeWins Publishing (“TradeWins”) a customized or personalized recommendation to buy, sell, hold, or invest in particular financial products. The Services are intended to supplement your own research and analysis.
2) TradeWins’ Services are not a solicitation or offer to buy or sell any financial products, and the Services are not intended to provide money management advice or services.
3) Past performance is not necessarily indicative of future results. Trading and investing involve substantial risk. Trading on margin carries a high level of risk, and may not be suitable for all investors. Other than the refund policy detailed elsewhere, TradeWins does not make any guarantee or other promise as to any results that may be obtained from using the Services. No person subscribing for the Services (“Subscriber”) should make any investment decision without first consulting his or her own personal financial adviser, broker or consultant. TradeWins disclaims any and all liability in the event anything contained in the Services proves to be inaccurate, incomplete or unreliable, or results in any investment or other loss by a Subscriber.
4) You should trade or invest only “risk capital” – money you can afford to lose. Trading stocks and stock options involves high risk and you can lose the entire principal amount invested or more.
5) All investments carry risk and all trading decisions made by a person remain the responsibility of that person. There is no guarantee that systems, indicators, or trading signals will result in profits or that they will not produce losses. Subscribers should fully understand all risks associated with any kind of trading or investing before engaging in such activities.
6) Some profit examples are based on hypothetical or simulated trading. This means the trades are not actual trades and instead are hypothetical trades based on real market prices at the time the recommendation is disseminated. No actual money is invested, nor are any trades executed. Hypothetical or simulated performance is not necessarily indicative of future results. Hypothetical performance results have many inherent limitations, some of which are described below. Also, the hypothetical results do not include the costs of subscriptions, commissions, or other fees. Because the trades underlying these examples have not actually been executed, the results may understate or overstate the impact of certain market factors, such as lack of liquidity. Simulated trading services in general are also designed with the benefit of hindsight, which may not be relevant to actual trading. In addition, hypothetical trading does not involve financial risk, and no hypothetical trading record can completely account for the impact of financial risk of actual trading. TradeWins makes no representations or warranties that any account will or is likely to achieve profits similar to those shown.
7) No representation is being made that you will achieve profits or the same results as any person providing testimonial. No representation is being made that any person providing a testimonial is likely to continue to experience profitable trading after the date on which the testimonial was provided, and in fact the person providing the testimonial may have experienced losses.
8) The author experiences are not typical. The author is an experienced investor and your results will vary depending on risk tolerance, amount of risk capital utilized, size of trading position and other factors. Certain Subscribers may modify the author methods, or modify or ignore the rules or risk parameters, and any such actions are taken entirely at the Subscriber’s own election and for the Subscriber’s own risk.