In this webinar, Keith Harwood, President and Chief Options Strategist at Option Hotline, joins us to discuss how he buys in a bear market. Over the last few months, the equities market has continued to fall, but there are many ways to trade and invest in this type of market environment.
Learn how professional traders spot opportunities that can create returns and define risk by using options trading.
You'll also receive a free gift from Keith just for signing up, so make sure you Register Now!
Make sure to register even if you cannot attend live so you may receive the recorded replay.
Tomorrow, you could begin doubling your account every single month starting with one letter.
The letter will come from a 20-year trading professional named Ian Cooper. He says, “In 2022, following my trades you would be doubling even tripling your account some months. Let me show you how.”
He will show you exactly what to do... and he’ll give you the blueprint for just $1.
Reversals: Doji Star and Shooting Star
by Adam Oliensis
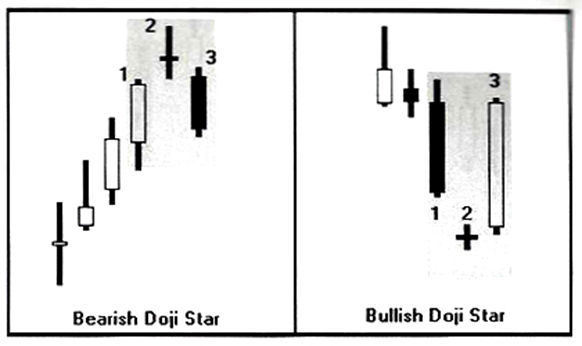
A Doji star is among the more potent of the Star formations. When candle #2 is a Doji it adds to the importance of the pattern. Why? The Doji, with identical or virtually identical opening and closing prices, indicates that the standoff between the bulls and the bears is completely balanced. The dynamic tension in the conflict is maximal. And a Doji on high volume adds even more tension into the situation.
The chart below shows a bearish Doji star and a bullish Doji star. These are just versions of the bearish evening star and the bullish morning star, with essentially the same dynamics.
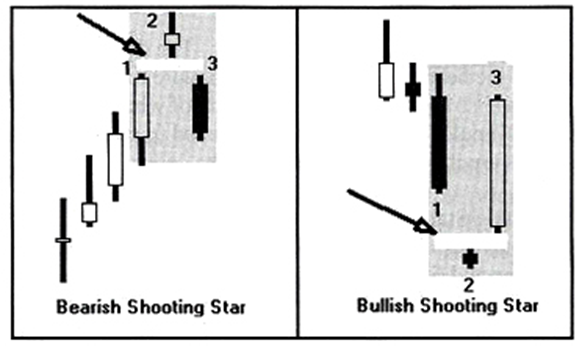
Next, we will cover the shooting star. A shooting star is perhaps the most powerful variation of the theme. What distinguishes this formation is a gap between candles #2 and #3.
The white band on each of the charts below show you the gap between candles #2 and #3 in the 3-candle pattern. So we have a gap between #1 and #2, and then another gap between #2 and #3. That makes candle #2 an “island.” So the shooting star is an island reversal, which is a well known pattern in Western Technical Analysis, and is extremely powerful. Candle #2 in this formation is “abandoned” by the prior and subsequent market activity. That is, the gaps on either side of #2 are quite meaningful. The gap between #1 and #2 is the market’s last, exhausted gasp in the direction of the trend. The gap between #2 and #3 is the market’s resounding rejection of the prices achieved by that last gap. The market races away from #2 as fast as it can, with its tail between its legs, and leaving its weapons in the field. In an uptrend, the shooting star now represents formidable resistance. In a downtrend, it represents a strong support level.
A two-star formation does not always become a three-day reversal pattern. So stay on your toes! It’s an alert that the three-day formation may be coming.
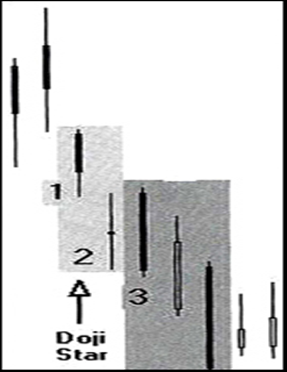
Below we have a prime example of a Doji star with potentially bullish implications (#2). And it’s a long-legged Doji, which should make it quite powerful. The conflict between bulls and bears ranged all over the battlefield on day #2, with each side gaining and losing large advantages. That could have “freaked out” the bears, as they had profits to protect from the prior downtrend. But on the following day (#3), we did not see the bears exhausted. Quite the contrary. The battle raged on the same field (price range) as it had the prior day. But in the end, the bulls caved in and retreated, with the stock closing near the session low.
So, what happened? Did the Doji star lie? No. The Doji star was a warning. The market could make no further downside progress that day, and that opened up the question of whether the tide might turn from bearish to bullish. But if you’d gone long on that two-day Doji star, you’d have been disappointed. Day #3 did not confirm the Doji as a reversal candle, but rather told us that the bears were still essentially in control, though meeting some resistance. Once the low of the Doji candle was penetrated, further downside continuation was in the cards.
This chart illustrates the importance of two things: First, if you trade on what might be a tentative reversal signal, you had better be careful, and you’d better not wed yourself to the reversal you expected. If the market tells you that the reversal just isn’t happening, then listen to it. Second, it’s important to know the difference between a preliminary, or warning signal on the one hand and a confirmed reversal signal on the other hand.
There are a whole variety of trading models and techniques. But the one thing they all have in common is that, to do them well you must remain open to what the market tells you. It’s very dangerous to have too much conviction in one direction if the market is giving you evidence to the contrary. So… if you’d gone long the Doji on an expectation of a reversal, you’d better have had a firm target before you went into the trade identifying where you would cut your loses if you were wrong.
PLEASE READ: Auto-trading, or any broker or advisor-directed type of trading, is not supported or endorsed by TradeWins. For additional information on auto-trading, you may visit the SEC’s website: All About Auto-Trading, TradeWins does not recommend or refer subscribers to broker-dealers. You should perform your own due diligence with respect to satisfactory broker-dealers and whether to open a brokerage account. You should always consult with your own professional advisers regarding equities and options on equities trading.
1) The information provided by the newsletters, trading, training and educational products related to various markets (collectively referred to as the “Services”) is not customized or personalized to any particular risk profile or tolerance. Nor is the information published by TradeWins Publishing (“TradeWins”) a customized or personalized recommendation to buy, sell, hold, or invest in particular financial products. The Services are intended to supplement your own research and analysis.
2) TradeWins’ Services are not a solicitation or offer to buy or sell any financial products, and the Services are not intended to provide money management advice or services.
3) Past performance is not necessarily indicative of future results. Trading and investing involve substantial risk. Trading on margin carries a high level of risk, and may not be suitable for all investors. Other than the refund policy detailed elsewhere, TradeWins does not make any guarantee or other promise as to any results that may be obtained from using the Services. No person subscribing for the Services (“Subscriber”) should make any investment decision without first consulting his or her own personal financial adviser, broker or consultant. TradeWins disclaims any and all liability in the event anything contained in the Services proves to be inaccurate, incomplete or unreliable, or results in any investment or other loss by a Subscriber.
4) You should trade or invest only “risk capital” – money you can afford to lose. Trading stocks and stock options involves high risk and you can lose the entire principal amount invested or more.
5) All investments carry risk and all trading decisions made by a person remain the responsibility of that person. There is no guarantee that systems, indicators, or trading signals will result in profits or that they will not produce losses. Subscribers should fully understand all risks associated with any kind of trading or investing before engaging in such activities.
6) Some profit examples are based on hypothetical or simulated trading. This means the trades are not actual trades and instead are hypothetical trades based on real market prices at the time the recommendation is disseminated. No actual money is invested, nor are any trades executed. Hypothetical or simulated performance is not necessarily indicative of future results. Hypothetical performance results have many inherent limitations, some of which are described below. Also, the hypothetical results do not include the costs of subscriptions, commissions, or other fees. Because the trades underlying these examples have not actually been executed, the results may understate or overstate the impact of certain market factors, such as lack of liquidity. Simulated trading services in general are also designed with the benefit of hindsight, which may not be relevant to actual trading. In addition, hypothetical trading does not involve financial risk, and no hypothetical trading record can completely account for the impact of financial risk of actual trading. TradeWins makes no representations or warranties that any account will or is likely to achieve profits similar to those shown.
7) No representation is being made that you will achieve profits or the same results as any person providing testimonial. No representation is being made that any person providing a testimonial is likely to continue to experience profitable trading after the date on which the testimonial was provided, and in fact the person providing the testimonial may have experienced losses.
8) The author experiences are not typical. The author is an experienced investor and your results will vary depending on risk tolerance, amount of risk capital utilized, size of trading position and other factors. Certain Subscribers may modify the author methods, or modify or ignore the rules or risk parameters, and any such actions are taken entirely at the Subscriber’s own election and for the Subscriber’s own risk.