Tomorrow, you could begin doubling your account every single month starting with one letter.
The letter will come from a 20-year trading professional named Ian Cooper. He says, “In 2017, following my trades you would be doubling even tripling your account some months. Let me show you how.”
He will show you exactly what to do... and he’ll give you the blueprint for just $1.
Death of News: One of the Easiest Ways to Spot Big Opportunity
by Ian Cooper
Fear is a trader’s best friend.
After all, it's how some of the top investors made their fortunes.
Sir John Templeton would tell investors to buy excessive pessimism.
Warren Buffett still advised that "a climate of fear is your friend when investing; a euphoric world is your enemy." And of course, we all remember his advice to "be fearful when others are greedy and greedy when others are fearful."
Baron Rothschild would tell investors, "The time to buy is when there’s blood in the streets, even if the blood is your own." He knew that very well, considering he made a small fortune buying the panic that followed the Battle of Waterloo against Napoleon.
If you can spot fear, as they did, you stand to make a fortune.
One of the best ways to do that is to spot where traders are overreacting to news.
Look at brokerage stocks for example.
Over the last few weeks, online brokerage stock took massive hits.
TD Ameritrade, E-Trade Financial, and Interactive Brokers all fell after Charles Schwab said it would cut all commissions for stock trading, ETFs and options on its mobile and web platforms. The move came just days after Interactive Brokers Group rolled out its IBKR Lite service, which also cut commissions for U.S. listed stocks and ETFs.
The news sent brokerage stocks screaming lower, as traders overreacted.
TD Ameritrade (AMTD) fell from $48 to $33
Interactive Brokers (IBKR) plummeted from nearly $54 to $45
Charles Schwab Corp. (SCHW) fell from $43 to $35
E-Trade Financial (ETFC) fell from $45 to $35
All as traders reacted to news brokers were trimming their fees.
However, once the news was priced in, and absorbed by the markets, fear lead to opportunity. Those that spotted the bottom in these stocks saw great returns.
TD Ameritrade (AMTD) would run from $33 to $39
Interactive Brokers (IBKR) ran from $45 to $48
Charles Schwab Corp. (SCHW) ran from $35 to $42
E-Trade Financial (ETFC) ran from $35 to $42
The Trick to Spotting Excessive Fear
If you pull a bungee cord too far, what happens? Eventually, it snaps back, right?
Well, the very same thing happens with stocks. If they become far too oversold, and get pulled in one direction too far, too fast, you’ll see it snap back – which is where we want to buy.
Believe it or not, it’s easy to spot.
Once we’ve spotted a stock, or even an index that fell on excessive fear, we want to look for four key technical pivot points that can lead to 85% success when they align. They include:
Bollinger Bands (2,20)
The Bands are typically placed two standard deviations above and below a moving average. For example, a trader may choose to use an intermediate-term moving average of 20 with two standard deviations above and below that average. When a stock touches or penetrates the lower band, the stock can be considered oversold.
Relative Strength (RSI) and Williams’ %R (W%R)
We can use RSI to confirm other indicators above. When RSI moves to or below its 30-line, we have an oversold condition. When Williams moves to or above the -80-line, it’s oversold.
Moving Average Convergence-Divergence (MACD)
MACD is calculated using the difference between a short-term and long-term trend and momentum behind a stock (typically 12-day and 26-day moving averages are used). With MACD, we’re simply looking for massive swings down to confirm what Bollinger Bands, Williams’ %R, and RSI are telling us.
However, each of the four indicators must align, and agree with one another for this to work.
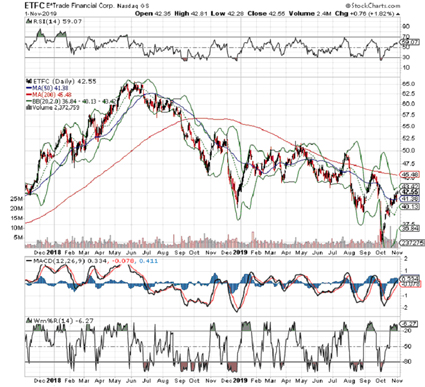
Look at the E-Trade Financial Corp. chart again.
Going back to October 2019, we can see the stock was crushed by commission-pricing wars. However, we can also spot the exact time of excessive fear, and opportunity.
For one, in October 2019, the stock slipped to its lower Bollinger Band (2,20), and became extremely oversold. In fact, look at what happens to this same stock over the last two years. We can clearly see that each time that lower Band is touched or penetrated, the stock has tended to pivot and move higher from that point.
Then again, we never want to rely on just one indicator.
Now, look at what RSI was telling us in early October 2019. RSI was slightly below its 30-line, oversold. It was confirming what the Bollinger Band was telling us. Again, if we look back at the last two years, we can see that each time RSI was at its 30-line and the stock slipped to its lower Band, the stock would pivot higher shortly thereafter.
Massive downward swings in MACD also confirm oversold conditions. Even Williams’ %R below its 80-line is a powerful indication of an oversold situation.
Combine all three indicators with excessive news-based fear, and opportunity can be found up to 85% of the time. In fact, pull up your favorite two-year stock chart with these technical indicators, and you’ll see how easy it becomes to find opportunity.
PLEASE READ: Auto-trading, or any broker or advisor-directed type of trading, is not supported or endorsed by TradeWins. For additional information on auto-trading, you may visit the SEC’s website: All About Auto-Trading, TradeWins does not recommend or refer subscribers to broker-dealers. You should perform your own due diligence with respect to satisfactory broker-dealers and whether to open a brokerage account. You should always consult with your own professional advisers regarding equities and options on equities trading.
1) The information provided by the newsletters, trading, training and educational products related to various markets (collectively referred to as the “Services”) is not customized or personalized to any particular risk profile or tolerance. Nor is the information published by TradeWins Publishing (“TradeWins”) a customized or personalized recommendation to buy, sell, hold, or invest in particular financial products. The Services are intended to supplement your own research and analysis.
2) TradeWins’ Services are not a solicitation or offer to buy or sell any financial products, and the Services are not intended to provide money management advice or services.
3) Past performance is not necessarily indicative of future results. Trading and investing involve substantial risk. Trading on margin carries a high level of risk, and may not be suitable for all investors. Other than the refund policy detailed elsewhere, TradeWins does not make any guarantee or other promise as to any results that may be obtained from using the Services. No person subscribing for the Services (“Subscriber”) should make any investment decision without first consulting his or her own personal financial adviser, broker or consultant. TradeWins disclaims any and all liability in the event anything contained in the Services proves to be inaccurate, incomplete or unreliable, or results in any investment or other loss by a Subscriber.
4) You should trade or invest only “risk capital” – money you can afford to lose. Trading stocks and stock options involves high risk and you can lose the entire principal amount invested or more.
5) All investments carry risk and all trading decisions made by a person remain the responsibility of that person. There is no guarantee that systems, indicators, or trading signals will result in profits or that they will not produce losses. Subscribers should fully understand all risks associated with any kind of trading or investing before engaging in such activities.
6) Some profit examples are based on hypothetical or simulated trading. This means the trades are not actual trades and instead are hypothetical trades based on real market prices at the time the recommendation is disseminated. No actual money is invested, nor are any trades executed. Hypothetical or simulated performance is not necessarily indicative of future results. Hypothetical performance results have many inherent limitations, some of which are described below. Also, the hypothetical results do not include the costs of subscriptions, commissions, or other fees. Because the trades underlying these examples have not actually been executed, the results may understate or overstate the impact of certain market factors, such as lack of liquidity. Simulated trading services in general are also designed with the benefit of hindsight, which may not be relevant to actual trading. In addition, hypothetical trading does not involve financial risk, and no hypothetical trading record can completely account for the impact of financial risk of actual trading. TradeWins makes no representations or warranties that any account will or is likely to achieve profits similar to those shown.
7) No representation is being made that you will achieve profits or the same results as any person providing testimonial. No representation is being made that any person providing a testimonial is likely to continue to experience profitable trading after the date on which the testimonial was provided, and in fact the person providing the testimonial may have experienced losses.
8) The author experiences are not typical. The author is an experienced investor and your results will vary depending on risk tolerance, amount of risk capital utilized, size of trading position and other factors. Certain Subscribers may modify the author methods, or modify or ignore the rules or risk parameters, and any such actions are taken entirely at the Subscriber’s own election and for the Subscriber’s own risk.