.jpg "TradeWins Publishing")
Follow Us:    
|
|
Don't Miss this Event
January 27, 2018
You're invited to join us at the Online Traders Summit, January 27th for 8 hours of in person trading instruction.
We've pulled out all the stops for this live trading event. Eight Industry Experts are going to show you what it takes to be a successful trader in ANY market with ANY account size!
This event is for traders of any level, and all presentations will be recorded and delivered to everyone that registers.
Register Now for Free
BONUS: Check out freebies offered by each instructor when you register!
Toni Turner – 10:00 AM ET
How to Power-Up Your Swing Trading Profits
Don Fishback – 11:00 AM ET
The Science of Pinpointing Explosive Stock Moves
Guy Cohen – 12:00 PM ET
The Trading Method with an Independently Proven Edge
John Bollinger – 1:00 PM ET
How to Use Bollinger Bands® to Best Capture Trading Opportunities
Geoff Bysshe – 2:00 PM ET
Hidden Trends - How to Identify and Profit from the next big winners
Bryan Rich – 3:00 PM ET
How To Make The World’s Best And Most Influential Billionaire Investors Work For You
Vlad Karpel – 4:00 PM ET
Using Price Patterns to Increase Your Trading Success
Jeff Gibby – 5:00 PM ET
Three Steps to a Successful Trade
Even if you can’t make the event, Register Here to receive the recorded sessions!

|
|
Ray trades only those opportunities where the profit potential is HUGE and the risks are small. And with Ray's uncanny approach to market timing you needn't wait long to profit. Occasionally your trades will last 2-3 weeks, but most often you'll double your money in 1-5 days! This keeps your stress, worry and financial risk down to an absolute minimum.
|
Amazing Secret of 59 Money Doublings In 56 Weeks!
Amazing Prodigy Turns $19,500 into $1.03 Million Without Rolling The Dice
Ray Frazier's amazing new book that reveals exactly how he found trades worth $1.03 Million and how you can do it too… without risking one thin dime!
He's made as much as a 753% profit in just three days. And in one stunning exhibition doubled his money nine times in just 13 days!! Meanwhile, with huge monthly profits over 92% of his trading record, his losses are almost negligible. In fact, his worst single contract loss was just $1,087.50… at a time he had already made over $200,000 in profits!
It's Amazing How Simple It Is To Double Your Money!
Huge Profits Now!!
|
|
|
|

Better Business Bureau
|
|
Click on authors name
to learn more
|
| |
|
|
When the Dow Jones Industrials exploded to an all-time high of 26,086, it did so just a week after hitting 25,000. That was the fastest 1,000-point rise we’ve ever seen.
After a 7,000-point move since Trump was elected, the bull market is alive and doing very well. However, with any substantial move in stocks, ETFs and markets, there are rules that all in investors should abide by. In this issue, we take a look the top five Trump Trades.
Next, Lee Gettess brings us his video newsletter on what he expects from the S&P and bond markets for the coming week.
Then Inside Trading brings you Ray Frazier. Also known as the Stock Doc, Ray explains how to interpret reversal patterns in the marketplace.
Last, Chuck Hughes offers his Guaranteed Real Optioneering Winners - Optioneering Newsletter.
Enjoy!
Adrienne LaVigne
TradeWins Publishing

|
|
Five Ways to Trade Tax Reform in 2018
by TradeWins Publishing
When the Dow Jones Industrials exploded to an all-time high of 26,086, it did so just a week after hitting 25,000. That was the fastest 1,000-point rise we’ve ever seen.
"We're just starting to see Corporate America tell us what a lower corporate tax rate means to the bottom line. We shouldn't dismiss that," noted Art Hogan, chief market strategist a B. Riley FBR, as quoted by CNN Money.
In short, 2018 was picking up where 2017 left off thanks to tax reform backed by global economic growth, stable U.S. unemployment, consumer spending, and earnings.
Even better, Goldman Sachs believes the bull market could run another three years.
In its latest market outlook, Goldman forecast a 15% gain in the S&P 500 over that period with a target of 3,100 by the close of 2020. Earnings growth, they noted will be a dominant driver of those gains. It’s also projecting a 14% gain in earnings for 2018 led by strong sales growth, and margin expansion as a result of recent tax reform. Without the tax cut, we may have only see earnings growth of 9%.
Better still, Goldman also just forecast an 8% jump in capex, a 5% rise in dividends and a 3% increase in buybacks. And it believes we could see net inflows of $400 billion into U.S. stocks with corporate buybacks and ETFs under considerable demand.
In short, even after a 7,000-point move since Trump was elected, the bull market is alive and doing very well. However, with any substantial move in stocks, ETFs and markets, there are rules that all in investors should abide by.
Thanks to the excitement generated by Trump, we’re all a little richer.
Trade Tax Reform
|
|
Lee Gettess' Market Sense
by Lee Gettess
Lee Gettess is a top trader who is excited to bring you his video newsletter. Each week, Lee will share his predictions on what he anticipates from the bond and S&P markets.
Watch Video
|
|
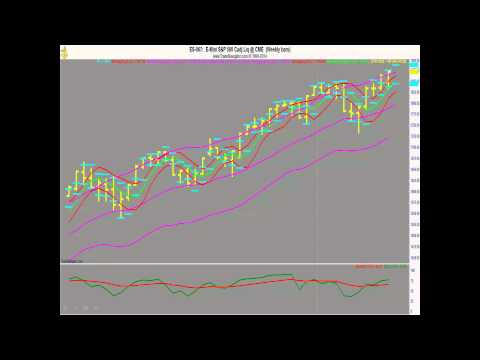
Reversal Chart Formations
by Ray Frazier
The following is an excerpt from Ray Frazier's Huge Profits Now!!
Double Top
The double top formation is considered a reversal pattern. The first top in the formation is formed by a rally in the stock on higher than average volume, only to see sellers come in to drive the stock price lower. The second top is formed by another rally in the stock but on lower volume than the previous top. The correction in the stock from the first top should be approximately 15%. The second top should be below the first tip (within 3%). The completion of this formation is as the stock price tips past the prior correction. The second correction will usually last for several weeks.
Double Bottom
The double bottom is considered to be a reversal pattern. The first bottom is formed on high-volume as investors bail out of the stock for one reason or another. This is followed by a rally of at least 15% as investors figure that the stock has hit bottom. This rally is met with selling from investors that did not get out during the first sell off. The second bottom is formed on lower volume than the first bottom and should be within 3% of the first. Confirmation of the reversal is when the second rally takes the stock above the peak of the first rally.
Below is an example of a double bottom formation. As you look at the chart, you can see that after the stock crosses the resistance line it continues to climb for about three weeks.
Reversal Chart Formations
|
Guaranteed Real Optioneering Winners
by Chuck Hughes
Every week Chuck publishes his Optioneering Newsletter. The following is a trade opportunity taken from his most recent issue.
The first profit opportunity we will consider this week is in OSTK, or Overstock.com. Overstock.com is an online 'closeout' retailer offering discount, brand-name merchandise for sale over the Internet. Their merchandise offerings include bed-and-bath goods, kitchenware, watches, jewelry, electronics, sporting goods and designer accessories.
The OSTK price at this month’s high was over six times the price at the August low. That’s a strong stock!
The daily chart for OSTK shows the rally to this month’s new record high. The subsequent pullback gives us a buying opportunity.
We are going to review a Call Debit Spread for OTSK. Traders who want a more leveraged approach could consider buying OSTK calls. OSTK has options expiring every week until March 2nd. After that, there are options expiring in mid- March, June, September, January 2019, and January 2010. Click Here to follow this trade.
To Learn More Click Here
|
|