Mastering the Art of Turtle Trading: Strategies and Tactics for Commodities Trading From a 20 Year Turtle Trading Veteran
Thursday, March 30th at 3:30PM ET
Don't miss out on this once-in-a-lifetime opportunity to learn from a master trader who has firsthand experience with one of the most successful trading strategies in history.
We are thrilled to announce an exclusive opportunity to gain invaluable insights from Steve Charpentier, the head trader of the legendary Turtle Trader's commodity program. With years of experience in the field, Steve is the perfect candidate to bring us up to date on the program's current status and its remarkable success in the ever-changing commodity markets.
Steve is a 20+ year veteran Turtle trader and long time trading partner to Russell Sands, one of the most successful Turtle traders of all time.
Bonus! For all those who stay until the end of the webinar, you will receive a copy of Russell Sands book, Breakout Trend Following Secrets: Extract Big Moves and Explosive Profits!
One of the best ways to trade any hot sector is with an exchange traded fund (ETF).
Not only does an ETF allow you to diversify among dozens of industry names, it also allows you to do so at far less cost. With it, I can gain exposure to stocks, such as Apple, Microsoft, Nvidia, Visa, Mastercard, Broadcom, Cisco, Accenture, and another 68 tech holdings.
Here are three of the top ETFs to consider as we get deeper into 2023.
Schwab U.S. Large Cap Value ETF (SCHV)
One of the best ways to diversify is with an ETF, such as the Schwab U.S. Large Cap Value ETF (SCHV), which carries a balanced portfolio of large cap value stocks. With an expense ratio of 0.04%, the ETF offers exposure to companies such as Berkshire Hathaway, Johnson & Johnson, Exxon Mobil, JP Morgan Chase, Home Depot, AbbVie, Pfizer, and Merck. Even better, the SCHV ETF has a dividend yield of 2.45% and has a quarterly payout.
KraneShares Electric Vehicles and Future Mobility ETF (KARS)
The Krane Shares Electric Vehicles and Future Mobility ETF (KARS) could accelerate.
After all, the electric vehicle boom is accelerating – and fast. Governments all over the world are pushing for a greener future. The U.S. just promised to cut emissions by up to 52%. Europe says it’ll cut emission by up to 55%. China will stop releasing CO2 in the next 40 years.
In doing so, they all want millions of electric vehicles on the roads. Fueling even more potential upside, states, like California are banning gas-powered cars by 2035. More are likely to follow. Even the European Union just approved a law that will ban the sale of new petrol and diesel cars starting in 2035.
That being said, the KARS ETF could be a top beneficiary. With an expense ratio of 0.70%, this ETF provides exposure to companies involved in the production of EVs and their components.
Anytime the price chart is too tight, either scale the chart to your screen or trim down the number of days of historical data. Stocks that have had a big range can end up looking too tight on the moving average charges. We usually want to have at least 200 periods total to accurately gauge the 200-period simple moving average level, but if the stock range is too large, the charts can be too tight to read. Use the scale to screen option (if applicable), or shrink the historic data.
Intraday Time Frames
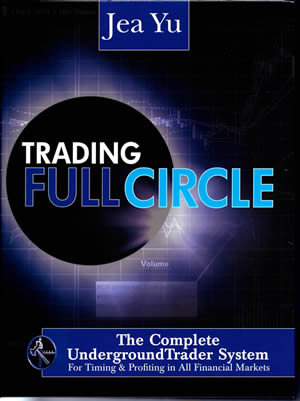
The Secret Tool Unveiled: The Rifle Charts
Every single trade I make or alert now goes through this new weapon, the 5- and 1-minute Full Data (24-Hour) Rifle Charts. I give credit to CobraTrading.com and their CobraIQ platform for being instrumental in my development and testing of this weapon. I created a preformatted template of the UndergroundTrader Rifle Charts for the CobraIQ platform at CobraTrading.com specifically for my readers and their clients, so open up an account there if you are serious about pursuing the trading journey. The advantage of the full time frame data fills in many gaps and gives a more thorough picture of the setups. I also added the 5-peiord simple moving average to the 1-minute chart, which is invaluable when playing mini pups to determine to the penny where the dynamic support level is. Kudos to my friends John and Phyllis Hill for helping me add that critical mechanism.
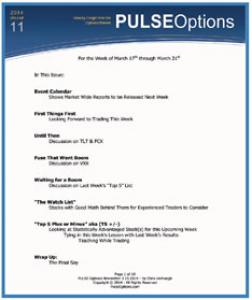
There’s not much on the Economic Calendar. There’s a couple of stocks releasing their Earnings next week which causes a little bit of interest on my part.
Monday, March 27
Before the Open: Carnival Cruise Lines (CCL) - because I’m a shareholder.
Tuesday, March 28
After the Close: Micron (MU) - because they’re headquartered in my town.
But the biggest event next week is the fact that it ends on Friday, March 31. Not only does the Month End on Friday, but so does the first Quarter of the year.
You might think I’m excited that Friday is one of just four Quarterly Expirations per year. But since it lands on a Friday which is already an expiration day, it’s basically meaningless. But what gets me excited is possible Window Dressing.
Understand most Mutual Funds only send out updates of their positions and Account Values on a Quarterly Basis. Quite often we find extra market volatility going into the end of a Quarter as Some Mutual Funds will look to Sell some Losers and/or Buy some Winners.
PLEASE READ: Auto-trading, or any broker or advisor-directed type of trading, is not supported or endorsed by TradeWins. For additional information on auto-trading, you may visit the SEC’s website: All About Auto-Trading, TradeWins does not recommend or refer subscribers to broker-dealers. You should perform your own due diligence with respect to satisfactory broker-dealers and whether to open a brokerage account. You should always consult with your own professional advisers regarding equities and options on equities trading.
1) The information provided by the newsletters, trading, training and educational products related to various markets (collectively referred to as the “Services”) is not customized or personalized to any particular risk profile or tolerance. Nor is the information published by TradeWins Publishing (“TradeWins”) a customized or personalized recommendation to buy, sell, hold, or invest in particular financial products. The Services are intended to supplement your own research and analysis.
2) TradeWins’ Services are not a solicitation or offer to buy or sell any financial products, and the Services are not intended to provide money management advice or services.
3) Past performance is not necessarily indicative of future results. Trading and investing involve substantial risk. Trading on margin carries a high level of risk, and may not be suitable for all investors. Other than the refund policy detailed elsewhere, TradeWins does not make any guarantee or other promise as to any results that may be obtained from using the Services. No person subscribing for the Services (“Subscriber”) should make any investment decision without first consulting his or her own personal financial adviser, broker or consultant. TradeWins disclaims any and all liability in the event anything contained in the Services proves to be inaccurate, incomplete or unreliable, or results in any investment or other loss by a Subscriber.
4) You should trade or invest only “risk capital” – money you can afford to lose. Trading stocks and stock options involves high risk and you can lose the entire principal amount invested or more.
5) All investments carry risk and all trading decisions made by a person remain the responsibility of that person. There is no guarantee that systems, indicators, or trading signals will result in profits or that they will not produce losses. Subscribers should fully understand all risks associated with any kind of trading or investing before engaging in such activities.
6) Some profit examples are based on hypothetical or simulated trading. This means the trades are not actual trades and instead are hypothetical trades based on real market prices at the time the recommendation is disseminated. No actual money is invested, nor are any trades executed. Hypothetical or simulated performance is not necessarily indicative of future results. Hypothetical performance results have many inherent limitations, some of which are described below. Also, the hypothetical results do not include the costs of subscriptions, commissions, or other fees. Because the trades underlying these examples have not actually been executed, the results may understate or overstate the impact of certain market factors, such as lack of liquidity. Simulated trading services in general are also designed with the benefit of hindsight, which may not be relevant to actual trading. In addition, hypothetical trading does not involve financial risk, and no hypothetical trading record can completely account for the impact of financial risk of actual trading. TradeWins makes no representations or warranties that any account will or is likely to achieve profits similar to those shown.
7) No representation is being made that you will achieve profits or the same results as any person providing testimonial. No representation is being made that any person providing a testimonial is likely to continue to experience profitable trading after the date on which the testimonial was provided, and in fact the person providing the testimonial may have experienced losses.
8) The author experiences are not typical. The author is an experienced investor and your results will vary depending on risk tolerance, amount of risk capital utilized, size of trading position and other factors. Certain Subscribers may modify the author methods, or modify or ignore the rules or risk parameters, and any such actions are taken entirely at the Subscriber’s own election and for the Subscriber’s own risk.