Courtesy Reminder: Today is your last day to attend this tell-all webinar for FREE!
Thousands of men & women have paid $2,977 or more to learn the trading secrets I'm going to share with you in this FREE webinar, (if you can still get in)... and many say it's the best investment they ever made.
In fact, after reviewing my latest broker statements, my options trades show $3.472 Million in actual profits and 98.2% trade accuracy! I'll teach you that secret – and so much more in this jam-packed free webinar!
If you're like most traders, you probably don't know any of the things I'll be teaching in today's 'last chance' webinar.
But I believe you'll be a better trader if you do!
Everything you need to know will be fully revealed in easy-to-learn detail... I'm leaving out nothing.
Tomorrow, you could begin doubling your account every single month starting with one letter.
The letter will come from a 20-year trading professional named Ian Cooper. He says, “In 2017, following my trades you would be doubling even tripling your account some months. Let me show you how.”
He will show you exactly what to do... and he’ll give you the blueprint for just $1.
Many commodities, and even some individual stocks or stock groups, have recurring fundamental factors that affect their prices. These forces can be seen by analyzing a market by day of week, day of month, or day of year. This is called seasonal trading.
Types of Fundamental Forces
Three types of fundamental forces cause seasonal trading patterns. The first type is based on events that have fixed or relatively fixed dates. Examples are: The pollination of corn in late June and early July, and the filing of federal tax returns on April 15.
Many seasonal forces are related to events for which the date could change – for example, the government's release of the current unemployment numbers. If these dates remain fairly constant for many years, then seasonal effects can be identified. If these dates change slightly, it may look as if the seasonal pattern has changed when, in actuality, the seasonal bias relative to the reports has not changed. For example, the Thursday before the monthly unemployment numbers is scheduled to be announced has a downward bias in the T-Bond market.
The third type of fundamental forces is based on human psychological factors. For example, in the stock market, Mondays have an upward bias because many traders exit their positions on the preceding Friday and reenter them on Monday. This Monday bias has existed at least since the 1970s, but it has been magnified since the 1987 Black Monday crash. For example, since the 1987 crash, Mondays have had an upward bias of over .60 point per trade, or about $300.0, on a futures contract on an open-to-close basis. Before the crash, the bias was about $138.00 per trade. The crash magnified the fear of hold positions over a weekend. This fear enhanced the upward bias on Mondays and changed the psychology of the market.
Calculating Seasonal Effects
Now that we understand why seasonal trading works, let's discuss different ways of calculating these measures.
The simplest method is to use price changes – different prices from open to close or from close to close. This type of seasonal analysis works very well for day-of-week and day-of-month analyses. When calculating seasonality on a yearly basis, price changes or several other methods can be used to capture the effects of these recurring fundamental forces.
One alternate method is to calculate the seasonal effect using a de-trended version of the data. The simplest way to de-trend a price series is to subtract the current price from a longer-term moving average. Another popular method for calculating seasonality is to standardize the data on a contract-by-contract or year-by-year basis – for example, by identifying the highest or lowest price on each contract or year and using it to create a scaled price.
Measuring Seasonal Forces
Let's first discuss measuring these seasonal forces based on the day of the week. Day-of-week forces can be measured in several ways. The first way is to measure the change on an open-to-close or a close-to-close basis – for example, measure the close-to-open change every Monday on the S&P 500. Another, even more powerful, variation is to compare only one day of the week throughout the month – Mondays in December, for example. As we will see later, this type of analysis can produce amazing results.
Using another form of day-of-week analysis, you would map where the high and low for a given week will occur. This information can help you pinpoint when, during a given week, you should take a position historically. On a shorter-term basis, it can tell you how strong the bear or bull market is. In bull markets, the high occurs later in the week; in bear markets, the high is earlier in the week.
The final form of day-of-week analysis is conditional day-of-week analysis. Buying or selling is done on a given day of the week, based on some condition – for example, buy on a Tuesday when Monday was a down day. This type of analysis can produce simple and profitable trading patterns.
Larry Williams, a legendary trader, developed the concept of trading day-of-month analysis. This concept is very powerful for discovering hidden biases in the markets. There are two major ways to use this type of analysis: (1) on an open-to-close or close-to-close basis, and (2) more often, by buying or selling on a given trading day of the month, and holding for N days. When a holding period is used, this type of analysis can produce tradable systems by just adding money management stops.
Let's now discuss three methods for calculating seasonality on a yearly basis. The first method originated in the work of Moore Research, which calculates seasonality on a contract-to-contract basis, using a calendar day of the year. Moore Research converts prices into a percentage of yearly range and then projects this information to calculate the seasonal.
The second method is the work of Sheldon Knight, who developed a seasonal index he calls the K Data Time Line. The calculation involves breaking down each year according to the occurrences on a given day of the week in a given month. The steps for calculating the K Data Time Line are as follows:
Identify the day-of-week number and the month for each day to be plotted – for example, the first Monday of May.
Find the 5-year price changes in the Dollar for that day, in each of the years identified.
Add the 5-year average price change for that day to the previous day’s time line value. The full-year time line value starts at zero.
Trade by selecting the tops and bottoms of the time line for your entries and exits. Buy the bottoms of the time line and sell the tops.
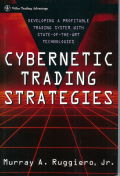
The final method is one that I use in my seasonal work. I call it the Ruggiero/Barna Seasonal Index. This index is part of a product we call the Universal Seasonal, a TradeStation or SuperCharts add-in that automatically calculates many different measures of seasonality if the historical data are available. This tool will work on all commodities and even on individual stocks.
The Ruggiero/Barna Seasonal Index
The Ruggiero/Barna Seasonal Index was developed by myself and Michael Barna. The calculations for this index are shown here:
Develop your seasonal and update it as you walk forward in the data.
For each trading day of the year, record the next N-day returns and what percentage of time the market moved up (positive returns) and down (negative returns).
Multiply this 5-day return by the proper percentage.
Scale the numbers calculated in step 3 between -1 and 1 over the whole trading year. This is the output value of the Ruggiero/Barna Seasonal Index.
I would like to make one point about the Ruggiero/Barna Seasonal Index: It is calculated rolling forward. This means that all resulting trades are not based on hindsight. Past data are used only to calculate the seasonal index for tomorrow's trading. This allows development of a more realistic historical backtest on a seasonal trading strategy.
Besides the Ruggiero/Barna Seasonal Index, you can use the raw average returns, the percent up or down, and correlation analysis to develop trading strategies. The Ruggiero/Barna index can be calculated either by using the complete data set or by using an N-year window.
Static and Dynamic Seasonal Trading
A seasonal trade can be calculated using the complete day set, some point in the past, or a rolling window of data. This is true for day-of-week, day-of-month, and day-of-year seasonals. The question is: Which method is the best? The answer depends on the commodity being analyzed. For example, in markets with fixed fundamentals, the more data used and the longer they are used, the greater the reliability of the seasonal. If we were analyzing corn, we would want to go back, using as much data as possible On the other hand, if we were doing seasonal research on the bond market, we would not want to use any day before January 1, 1986, because, prior to 1986, the dynamics of the bond market were different.
Another important issue in calculating seasonality is basing results on in-sample trades versus walk forward testing. For example, if we say a given seasonal is 80 percent accurate over the past 15 years, based on the results of the seasonal trades over the past 15 years, that is an in-sample result. If we use one day in the past 15 years to calculate a seasonal and then only take trades in the future using a buy and sell date calculated on past data, and roll the window forward every day, this is walk forward testing. More realistic results may be possible. For example, in 1985, you might not have had a seasonal bias on a given day, but, years later, that day of the year is included in a given walk forward seasonal pattern. Suppose you calculate the seasonal walking forward using only data from 1970 to 1985. You trade in 1986 and then move the window up every year or so. In 1987, you would use data including 1986 to calculate the seasonal, and you could produce a realistic seasonal model that can be used to trade.
PLEASE READ: Auto-trading, or any broker or advisor-directed type of trading, is not supported or endorsed by TradeWins. For additional information on auto-trading, you may visit the SEC’s website: All About Auto-Trading, TradeWins does not recommend or refer subscribers to broker-dealers. You should perform your own due diligence with respect to satisfactory broker-dealers and whether to open a brokerage account. You should always consult with your own professional advisers regarding equities and options on equities trading.
1) The information provided by the newsletters, trading, training and educational products related to various markets (collectively referred to as the “Services”) is not customized or personalized to any particular risk profile or tolerance. Nor is the information published by TradeWins Publishing (“TradeWins”) a customized or personalized recommendation to buy, sell, hold, or invest in particular financial products. The Services are intended to supplement your own research and analysis.
2) TradeWins’ Services are not a solicitation or offer to buy or sell any financial products, and the Services are not intended to provide money management advice or services.
3) Past performance is not necessarily indicative of future results. Trading and investing involve substantial risk. Trading on margin carries a high level of risk, and may not be suitable for all investors. Other than the refund policy detailed elsewhere, TradeWins does not make any guarantee or other promise as to any results that may be obtained from using the Services. No person subscribing for the Services (“Subscriber”) should make any investment decision without first consulting his or her own personal financial adviser, broker or consultant. TradeWins disclaims any and all liability in the event anything contained in the Services proves to be inaccurate, incomplete or unreliable, or results in any investment or other loss by a Subscriber.
4) You should trade or invest only “risk capital” – money you can afford to lose. Trading stocks and stock options involves high risk and you can lose the entire principal amount invested or more.
5) All investments carry risk and all trading decisions made by a person remain the responsibility of that person. There is no guarantee that systems, indicators, or trading signals will result in profits or that they will not produce losses. Subscribers should fully understand all risks associated with any kind of trading or investing before engaging in such activities.
6) Some profit examples are based on hypothetical or simulated trading. This means the trades are not actual trades and instead are hypothetical trades based on real market prices at the time the recommendation is disseminated. No actual money is invested, nor are any trades executed. Hypothetical or simulated performance is not necessarily indicative of future results. Hypothetical performance results have many inherent limitations, some of which are described below. Also, the hypothetical results do not include the costs of subscriptions, commissions, or other fees. Because the trades underlying these examples have not actually been executed, the results may understate or overstate the impact of certain market factors, such as lack of liquidity. Simulated trading services in general are also designed with the benefit of hindsight, which may not be relevant to actual trading. In addition, hypothetical trading does not involve financial risk, and no hypothetical trading record can completely account for the impact of financial risk of actual trading. TradeWins makes no representations or warranties that any account will or is likely to achieve profits similar to those shown.
7) No representation is being made that you will achieve profits or the same results as any person providing testimonial. No representation is being made that any person providing a testimonial is likely to continue to experience profitable trading after the date on which the testimonial was provided, and in fact the person providing the testimonial may have experienced losses.
8) The author experiences are not typical. The author is an experienced investor and your results will vary depending on risk tolerance, amount of risk capital utilized, size of trading position and other factors. Certain Subscribers may modify the author methods, or modify or ignore the rules or risk parameters, and any such actions are taken entirely at the Subscriber’s own election and for the Subscriber’s own risk.